Monitoring purposes GOLD: Gold ETF GLD long at 173.59 on 9/21/11Long Term Trend monitor purposes: Flat

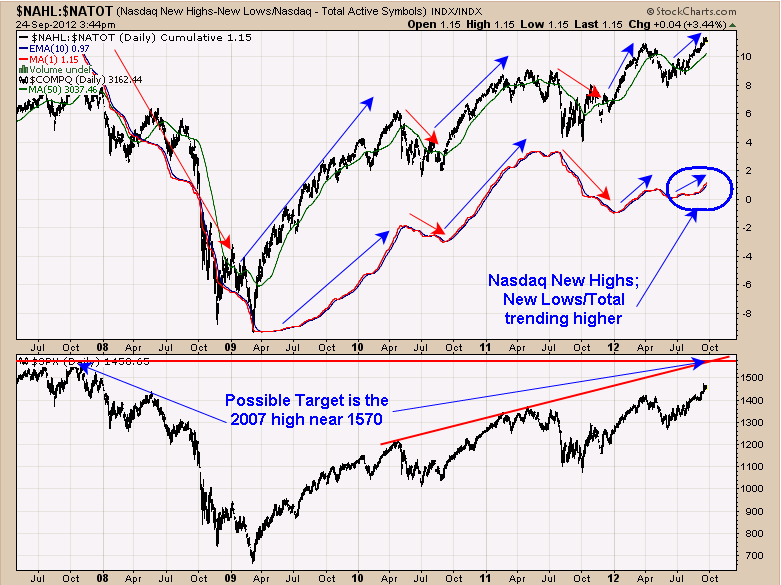
We showed this chart last week and is updated to yesterday’s trading which is the Nasdaq New highs; New lows/Total active symbols.
This indicator finds the direction of the markets for intermediate term and right now its trending higher and suggests the markets are in an uptrend. The Nasdaq has already broken to new highs but the SPX has not and may be where the SPX is heading. A possible target on SPX is the 2007 high near 1570.
Beginning in option expiration week ( last week) the SPX has traded sideways, appearing to form a “Consolidation phase” and building “Cause for the next move higher. Normally the longer the Consolidation (Cause) the longer the impulse wave will last. So far the Consolidation has lasted a week and a half and suggests the next impulse wave could last a week or longer. We are long the SPX on 9/13/12 at 1459.99. 
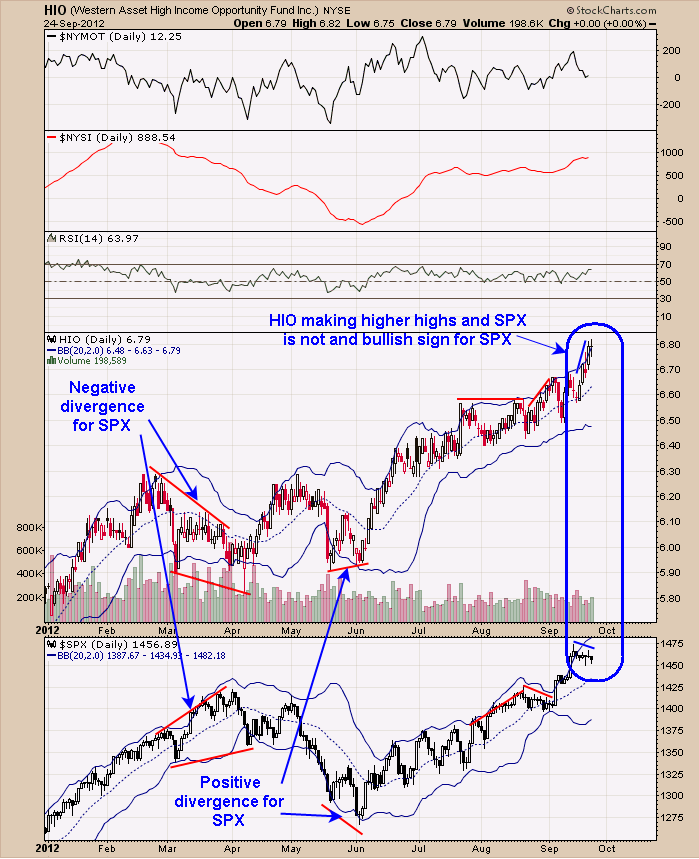
Above is the “Western Asset High Income Opportunity Fund” (HIO). This fund tracks the SPX closely and can give positive and negative divergences at highs and lows on the SPX. We have pointed out a couple of divergences on the chart above which are the March high and the June low. Currently the HIO is pushing higher where the SPX is going sideways. Normally the HIO leads the SPX and suggests at some point the SPX will also push higher. This positive divergence could lead to a rally in the SPX at any time. Sometimes the Ticks close and TRIN close will give a bullish sign when the next rally will start and of yesterday’s close on both of these indicators remained silent. 
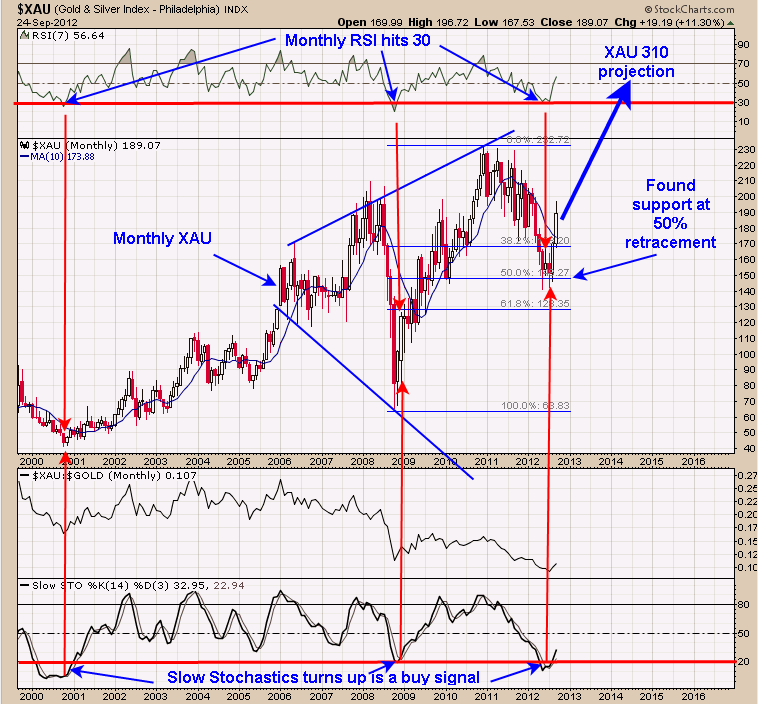
Above is the monthly XAU chart dating back to 2000. We have updated this chart to show the monthly buy signal that is now been triggered. The setup of this buy signal is for the monthly RSI to reach 30 or below (Check). Then the monthly slow stochastics needs to turn up from below 20 (was triggered in July). This type of signal was triggered at the 2000 as well as the 2008 lows and therefore is a rare signal but when they do occur it indicates a very strong rally coming.
Also notice that the XAU retraced 50% of the rally from the 2008 low and the choppy nature suggests that retracement was a consolidation. A 50% consolidation normally form at the half way point of the move and if its works out that way this go around would give a projection near 310 range on the XAU.
- Long GDX 58.65 on 12/6/11.
- Long SLV at 29.48 on 10/20/11.
- Long GDXJ average 29.75 on 4/27/12.
- Long GLD at 173.59 on 9/21/11.
- Long BRD at 1.67 on 8/3/11.
- Long YNGFF .44 on 7/6/11.
- Long EGI at 2.16, on 6/30/11.
- Long GLD at 147.14 on 6/29/11; stop 170 hit = gain 15.5% .
- Long KBX at 1.13 on 11/9/10.
- Long LODE at 2.85 on 1/21/11.
- Long UEXCF at 2.07 on 1/5/11.
We will hold as our core position in AUQ, CDE and KGC because in the longer term view these issues will head much higher. Holding CDE (average long at 27.7. Long CRYXF at 1.82 on 2/5/08. KGC long at 6.07. Long AUQ average of 8.25. For examples in how "Ord-Volume" works,
