🎁 💸 Warren Buffett's Top Picks Are Up +49.1%. Copy Them to Your Watchlist – For FreeCopy Portfolio

Is The Market Overheated?

Published 02/16/2017, 11:55 AM
Updated 05/14/2017, 06:45 AM
US500
-

The markets continue to make all-time highs, leaving many wondering how long this can last. We went ahead and looked at various momentum indicators, including the 14 day relative strength index (RSI).

Below is a chart of the S&P 500 RSI since 2010. As you can see, we are approaching 7 year highs in RSI, with the reading sitting at 78.01.

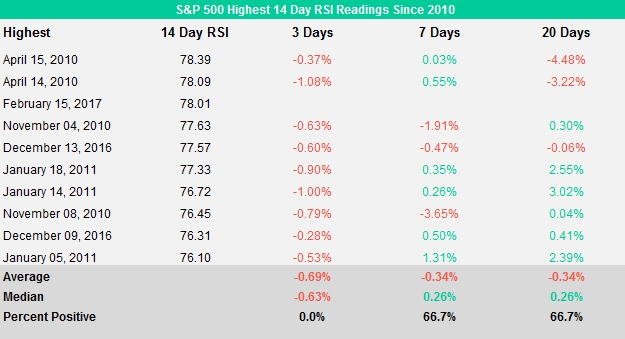
As illustrated below, the current reading is the 3rd highest since 2010, and the highest since April of that year. We went ahead and analyzed the historicial forward returns to see how markets have reacted to extremely high levels of momentum. We focused on the top 10 readings which highlighted to us that returns over the next 3 days were positive on no occasions, and averaged -.69%. The worst return was a mere -1%, which is nothing to panic about.

Over a 7 day trading period, and a 20 day trading period, the returns are fairly neutral. Over a 7 day period the returns averaged -.34%, finishing positive 67% of the time, and the worst return being -3.95%. Over a 20 day trading period returns averaged -.34%, finishing positive also 67% of the time, and the worst return was a drop of -4.48%. All in all, momomentum is elevated, therefore it is only normal for markets to consolidate and the historical numbers suggest this may be the case.
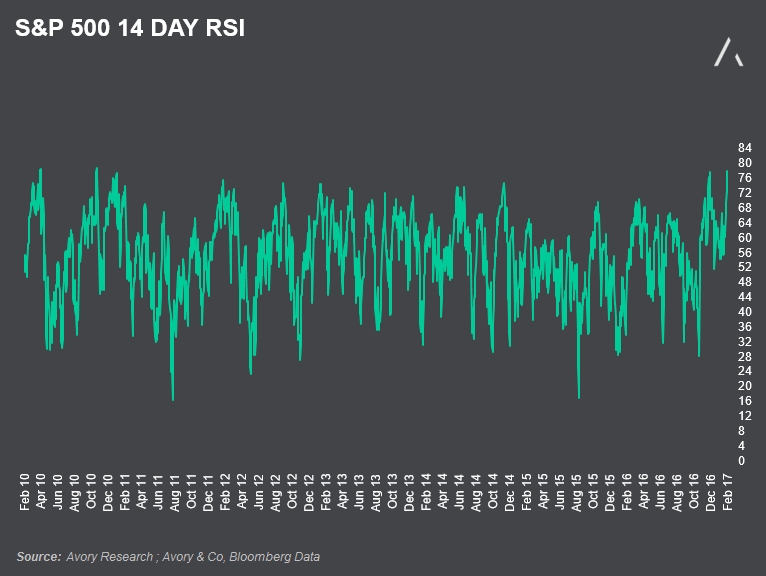
S&P 500 14 Day RSI Chart


S&P 500 Highest 14 Day RSI Readings Since 2010

Latest comments

Loading next article…
Risk Disclosure: Trading in financial instruments and/or cryptocurrencies involves high risks including the risk of losing some, or all, of your investment amount, and may not be suitable for all investors. Prices of cryptocurrencies are extremely volatile and may be affected by external factors such as financial, regulatory or political events. Trading on margin increases the financial risks.
Before deciding to trade in financial instrument or cryptocurrencies you should be fully informed of the risks and costs associated with trading the financial markets, carefully consider your investment objectives, level of experience, and risk appetite, and seek professional advice where needed.
Fusion Media would like to remind you that the data contained in this website is not necessarily real-time nor accurate. The data and prices on the website are not necessarily provided by any market or exchange, but may be provided by market makers, and so prices may not be accurate and may differ from the actual price at any given market, meaning prices are indicative and not appropriate for trading purposes. Fusion Media and any provider of the data contained in this website will not accept liability for any loss or damage as a result of your trading, or your reliance on the information contained within this website.
It is prohibited to use, store, reproduce, display, modify, transmit or distribute the data contained in this website without the explicit prior written permission of Fusion Media and/or the data provider. All intellectual property rights are reserved by the providers and/or the exchange providing the data contained in this website.
Fusion Media may be compensated by the advertisers that appear on the website, based on your interaction with the advertisements or advertisers.
© 2007-2024 - Fusion Media Limited. All Rights Reserved.