For the past couple of weeks we have been warning investors NOT to panic sell as the decline from the recent market highs ensued. The selloff had gotten the markets to very oversold conditions as concerns about the "fiscal cliff" and the "debt ceiling" pushed money managers to dump stocks with big gains to lock in lower tax rates.
As we have discussed many times in the past - markets never move in only one direction. This is why investing requires a strict discipline to not only "buy" but also when to "sell." This is why there are no great "buy and hold" investors that are written about in history. The truly great investors like Graham, Dodd, Buffett, Jones, Dalio, etc. all understood that making good investments was only one-half of the game. Knowing when to "sell" was just as important.
Markets are bound by the laws of physics to some degree. Prices can only diverge so far from their moving average before "gravity" will cause a reversion back to the norm. The first chart below is a simple analysis of the S&P 500 price index with outer bands that are 2-standard deviations above and below the 50-week moving average.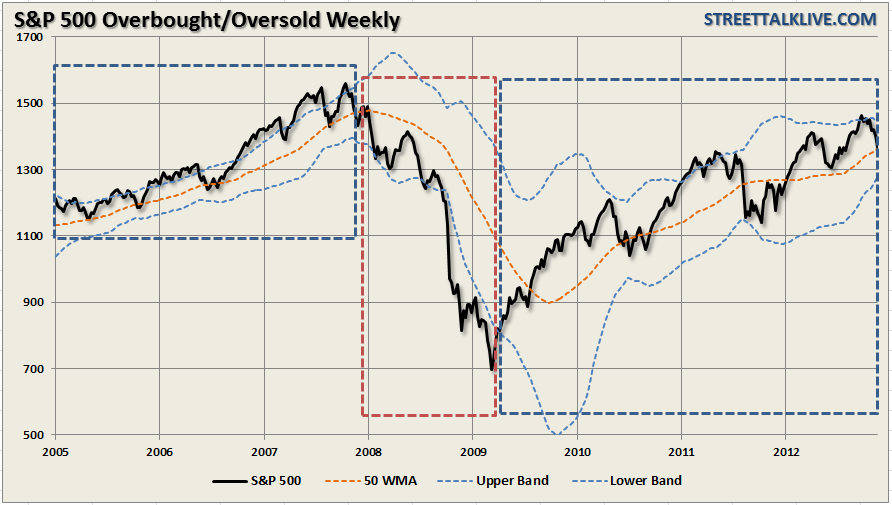
In bullish market trends the index price tends to stay between the upper band and the moving average (orange line). In bearish trends the index tends to stay between the moving average and lower band. The point here is that prices remain relatively confined to a range during bullish and bearish trends. This is why it is not only important to understand the direction of the trend but importantly to know when that trend has changed.
The chart below shows S&P 500 index with the same 2-standard deviation band structure as above. This time I have overlaid the chart with support and resistance levels.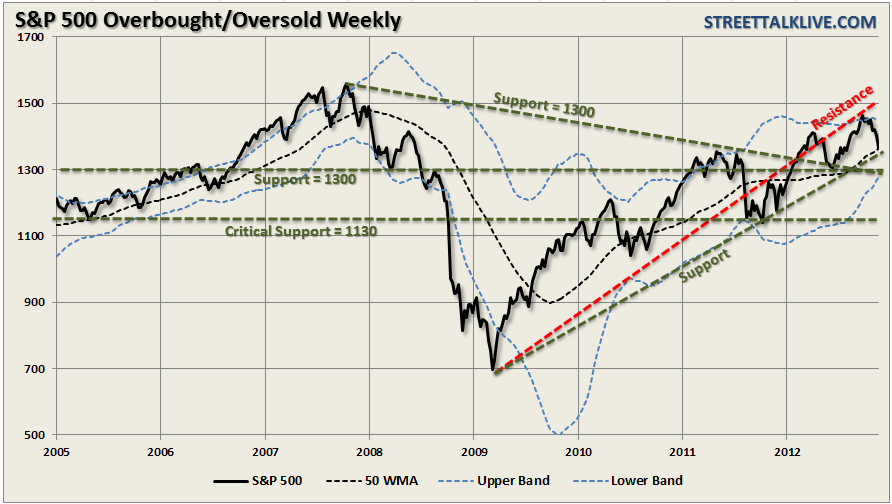
The downtrend line from the peak of the market in 2007 currently coincides with the 50-week moving average at 1300. This is going to provide a fairly strong level of support for the market in the near term. Likewise, the support line from the previous market tops in 2006 and the bottom in 2007 also provide additional support at the 1300 level. The market is currently beginning to test those levels and has held so far which is a bullish sign for the market.
What is important to notice is that in late 2007 the price of the market broke through the 50-week moving average and then tested the lower price band. This was the point where the trend changed from positive to negative. At this point the rules of portfolio management change.
There are TWO primary investment rules that SHOULD NEVER BE BROKEN.
- In a positive market trend – buy dips.
- In a negative market trend – sell rallies.
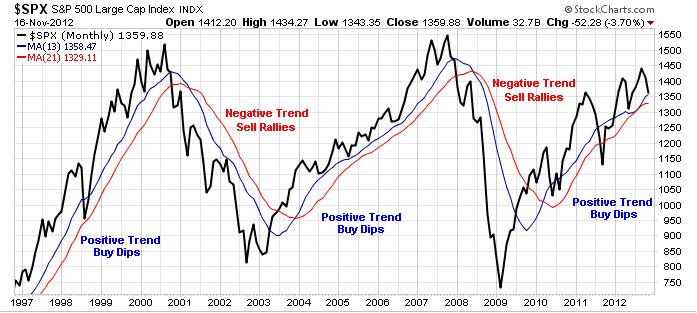
The chart above shows a monthly chart of the S&P 500 with a very simple 13/21 month moving average cross over indicator. I am using a monthly chart to eliminate much of the data "noise" so you can more clearly denote the changes between positive and negative market trends. As investors in the market the critical element to long term success is "risk" management.
While the markets are currently within the confines of a positive trend - we must be aware of the currently deteriorating trend of the data. As you can see from past history - a change in trend can happen very quickly leaving investors exposed to substantial downside risk.
Currently the market is still within the “buy the dip” mode, however, the deterioration in the economic, fundamental and geopolitical environment provide substantial headwinds to a further bull market advance in the market. Overvalued markets can remain overvalued as long as earnings are rising at a fast enough past to reduce valuations levels - that is currently no longer the case. The same is true in regards to the economic backdrop.
Watch The Bounce
We wrote in this past weekend's missive:
"Currently, the market is extremely OVERSOLD and, as we have discussed over the past several weeks, it is due for a corrective move to relieve that extended condition to the downside. With the market currently sitting on support – we should see a bounce during the pre-Thanksgiving week."
The markets rallied sharply on Monday on hopes, and I reiterate "hopes," that cooler heads will prevail in Washington, allowing the Government to push off the fiscal cliff / debt ceiling issues until sometime next year. I suspect that this will indeed by the case as there are signs that John "Jellyfish" Boehner is already showing willingness to throw in the towel.
The only positive from this "grand compromise" will be short term relief in the financial markets. The problem will simply resurface once again in six to twelve months for the markets to deal with once again. The issue is that the debt problem continues to grow unabated. At some point government officials are going to have to start tackling real reforms in Washington will suppress economic growth. However, that is a different blog for another day.
In the short term the markets will likely rally from their current deeply oversold short term condition. The target for that rally is 1430 based on current technical conditions, however, given the fact that the markets have issued a confirmed "sell" signal - it is likely that market action will remain confined at least through the end of the year. 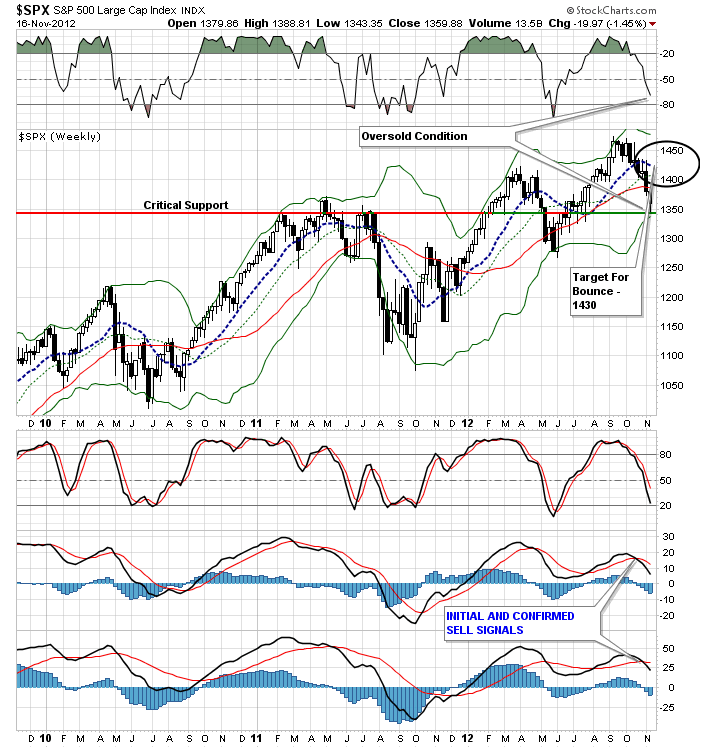
Given the weight of technical evidence combined with the economic and fundamental weakness - we continue to run a more conservative asset allocation model currently. 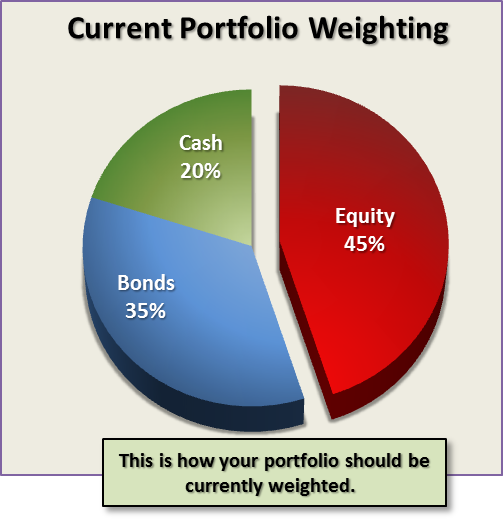
The model remains overweight cash as a hedge against market volatility. We remain fully invested, 35% of the portfolio, in individual bonds that yield income and provide a “return of principal” function at maturity. In this area we favor corporate bonds at the lower end of the investment grade rating scale that have “A” rated balance sheets. Lastly, the equity portion of the portfolio remains underweight and invested in low volatility investments primarily focused in defensive, dividend yielding, areas.
The current bounce in the market is not likely the next great cyclical bull market advance. If I am correct in my assumptions about continuing economic weakness brought about by the Eurozone recession then as part of a prudent "risk" management strategy the current bounce should be used to:
- Rebalance portfolios
- Sell losers
- Overweight strong fixed income credits
- Sell “high yield” (junk) credits
- Sell small and mid-cap stocks (highest risk to earnings recession)
- Sell international and emerging market exposure
- Evaluate fundamentals of large cap exposure. Sell over valued holdings.
- Overweight US dollar
- Overweight US Treasuries
- Sell Homebuilders & REITS
- Underweight Technology, Energy and Finance
- Overweight Utilities and Staples
In golf there is a saying that you "drive for show and putt for dough" meaning that it is not necessary to be able to drive a golf ball 300 yards down range - it is the putting that will win the game. Investing is much the same - being invested in the market is one thing; but understanding the "short game" of investing is what separates the winners from the losers. Focus on managing the "risk" of the portfolio rather than chasing "returns."
By minimizing the risk of loss over time the returns will come as a function of a solid asset allocation and risk management protocol. While the media, and Wall Street, focus on the daily "noise" of headlines - most investors will be significantly better off turning off the television, putting down the newspaper and focusing on the objectives of the portfolio, managing the risk, saving more and letting common sense guide investment decisions. It is your money after all. If you do not pay attention to it - it is unlikely that anyone else with either.
