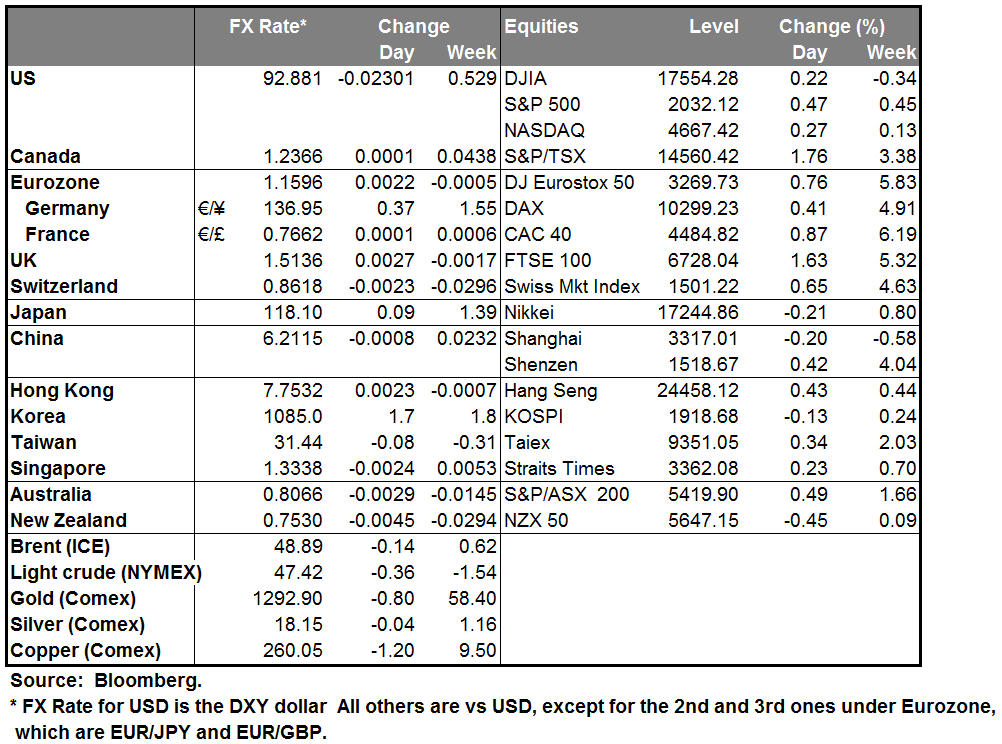
Retreat of the hawks Falling commodity prices and the risk of deflation are causing central banks to change their monetary stance. Yesterday we saw three central banks – the Bank of England, the Bank of Canada and perhaps the ECB – dial down their monetary stance and move to a looser policy. These same factors are affecting central banks all over the world, so we can expect (or at least speculate about) similar moves from other central banks in coming weeks. And as these looser policies, taken for domestic reasons, have external spillovers, we can look forward to a resumption of the “currency wars” that were so much a topic in the FX market before the Fed started talking about “tapering” off its QE bond purchases in May 2013.
The day started with the Bank of England’s retreat. Previously, two of the nine members of the Monetary Policy Committee had been voting to raise rates. Yesterday’s minutes showed that the vote is now unanimous to keep rates steady, despite a further fall in unemployment and rise in average wages. Falling oil prices have now made the risk of deflation greater than the risk of inflation.
Next was the ECB as Bloomberg floated a story to the effect that the ECB would discuss a program of buying EUR 50bn in bonds every month until the end of 2016, which would make it an EUR 1.1tn QE program, more than double the EUR 500bn that the market is expecting. The news was offset shortly thereafter by a similar Wall Street Journal story that also mentioned EUR 50bn a month, but only for one year. This reminded people that these are only proposals and indeed anything may be discussed today, but only one will be agreed upon. In fact the amount of the monthly purchases is the crucial issue, not the duration, because the market will discount a lengthening of the program if it proves to be unsuccessful. It’s much easier for them to vote for a one-year program and then vote to extend it if necessary than it is to vote for a two-year program from the outset.
Finally, the Bank of Canada surprised the market with a 25 bps cut in rates, the first change since it hiked rates to 1% in Sep. 2010. Gov. Poloz’s statement accompanying the change repeatedly mentioned falling oil prices (the word “oil” appears 14 times in the 867-word statement). He also noted that “The Bank has room to maneuver should its forecast prove to be either too pessimistic or too optimistic,” meaning that they could lower rates again should their forecast of a return to USD 60/bbl prove wrong. I think their oil forecast is likely to be wrong and that they will have to cut further, which is why I remain bearish on CAD.
Who might be next? The market immediately started speculating on who might be next to cut rates and turned its attention to the other commodity currencies. AUD and NZD sank along with CAD, and the technicals look pretty bad for them both: AUD (see below) and NZD, which just broke out on the downside of the sideways channel it’s been trading in since December. NOK strengthened considerably however, perhaps because they seem to be the one country in the world not facing deflation, or maybe because of the rebound in oil prices (Brent +1%). On the other hand, CHF was the strongest G10 currency – I guess the idea there is that they’ve given up the fight against deflation and no further easing is likely. A country in deflation should see its nominal currency rate appreciate against countries not in deflation, so that move may be modestly justified, although it remains to be seen just how much deflation they face.
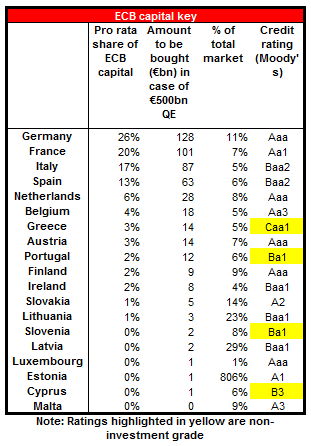
Today’s highlights: Of course we are all waiting for today’s ECB meeting. As mentioned above, the size of the bond purchase will be more important than the duration, because they can always extend their program, as the Fed did (of course they can always increase it too, as the Bank of Japan did). Anything less than EUR 50bn a month for one year – EUR 600bn – will probably now be a disappointment and cause EUR to strengthen. The market will also be looking to see whether it involves mutualisation of risk – that is, whether the ECB itself will buy all countries’ bonds -- or whether each national central bank will be responsible for buying its own country’s bonds in an effort to avoid mutualisation of risk. Mutualisation of risk will be a much bigger show of solidarity within the eurozone and hence a stronger statement, but personally I think they will probably go for non-mutualisation in order to get the Northern countries on board. It’s widely expected that the amount of each country’s bonds to be purchased will be follow that country’s contribution to the ECB’s capital, its so-called “capital key.” They will have to decide what credit ratings they can buy and whether to buy Greek bonds (I expect them to be excluded). Other points to watch will be whether they include EU agency bonds and corporate bonds. Finally, it would add to the psychological impact if the vote is unanimous, while a majority vote (more likely, in my view) would send a weaker signal of commitment.
In Sweden, the unemployment rate for December is expected to remain unchanged from the previous month.
In the US, we get the initial jobless claims for the week ended Jan.17 and the FHFA house price index for November.
The Market
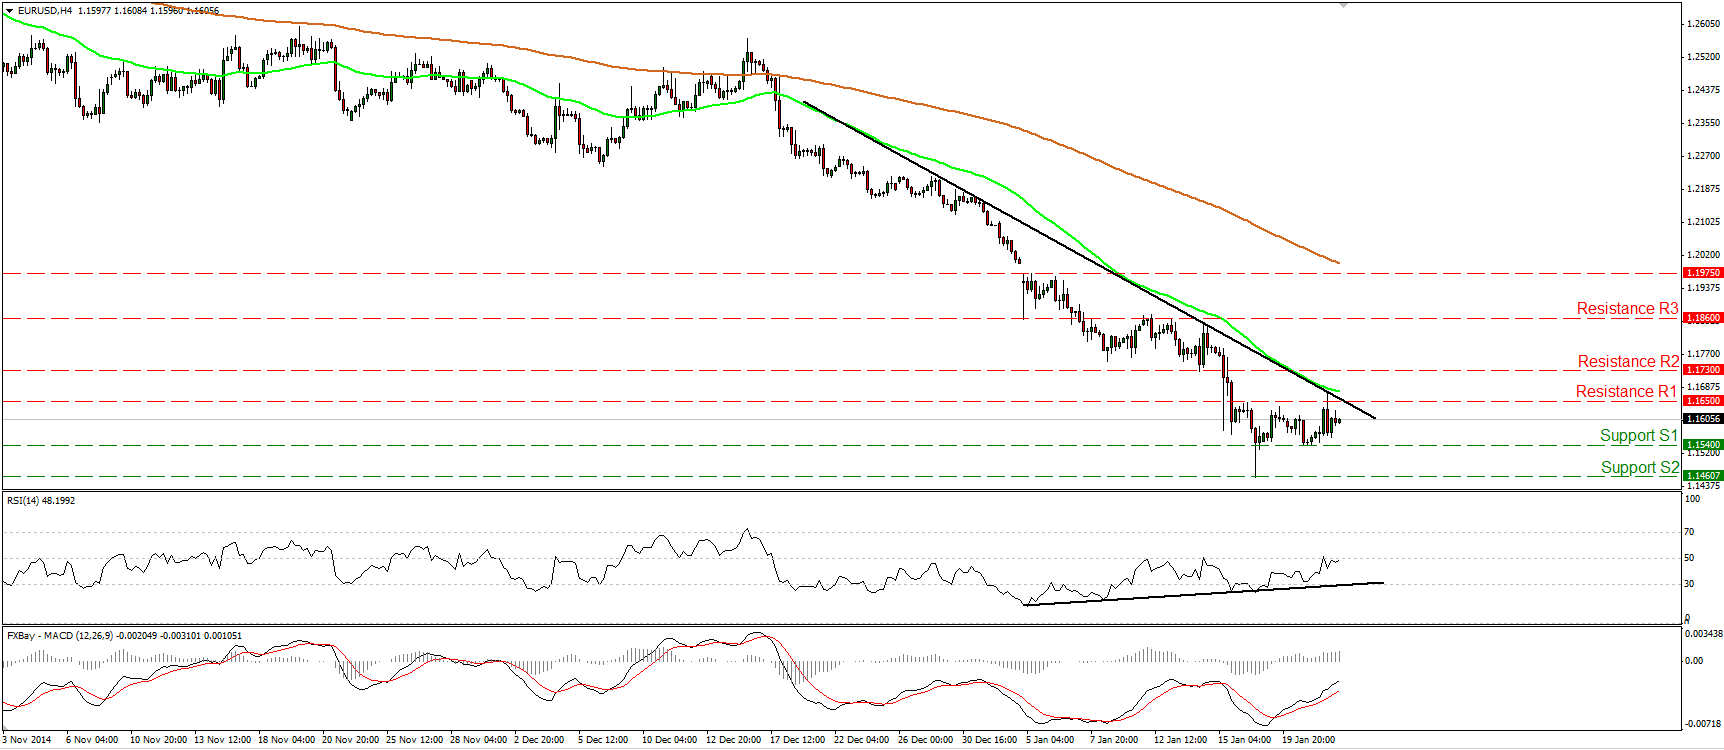
EUR/USD hits the near-term trend line
EUR/USD edged higher yesterday, but after hitting the black near-term downtrend line, it retreated to settle between the resistance line of 1.1650 (R1) and the support of 1.1540 (S1). In my view, the short-term technical picture stays negative, but much of today’s directional movement will depend on the ECB meeting and its decision on QE, which will determine the short-term bias of this pair. In the bigger picture, the price structure still suggests a longer-term downtrend. The pair is printing lower peaks and lower troughs below both the 50- and the 200-day moving averages. I would expect a move below 1.1460 (S2) in the close future, to pull the trigger for the 1.1370 (S3) area, defined by the low of the 7th of November 2003.
• Support: 1.1540 (S1), 1.1460 (S2), 1.1370 (S3).
• Resistance: 1.1650 (R1), 1.1730 (R2), 1.1860 (R3).
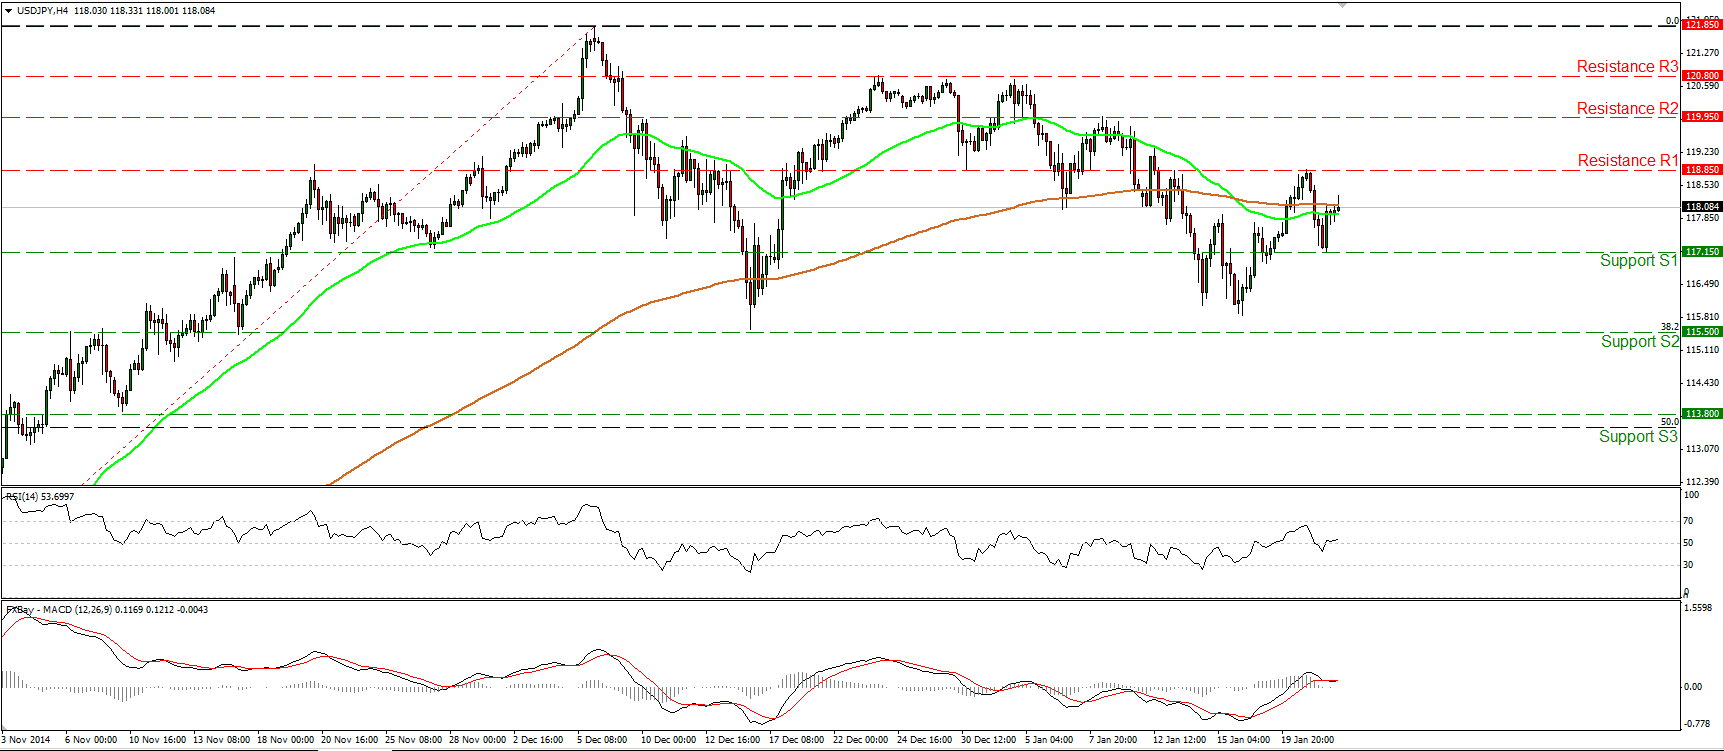
USD/JPY rebounds from 117.15
USD/JPY slid after hitting resistance near 118.85 (R1), but triggered some buy orders around 117.15 (S1) and regained about half of its losses. Yesterday’s move printed a higher low on the 4-hour chart and shifted the short-term bias cautiously to the upside. A clear move above 118.85 (R1) would confirm a forthcoming higher high and perhaps open the way for the next resistance of 119.95 (R2). On the daily chart, the rate appears to be forming a possible triangle formation, indicating a medium-term pause in the major uptrend.
• Support: 117.15 (S1), 115.15 (S2), 113.80 (S3).
• Resistance: 118.85 (R1), 119.95 (R2), 120.80 (R3).
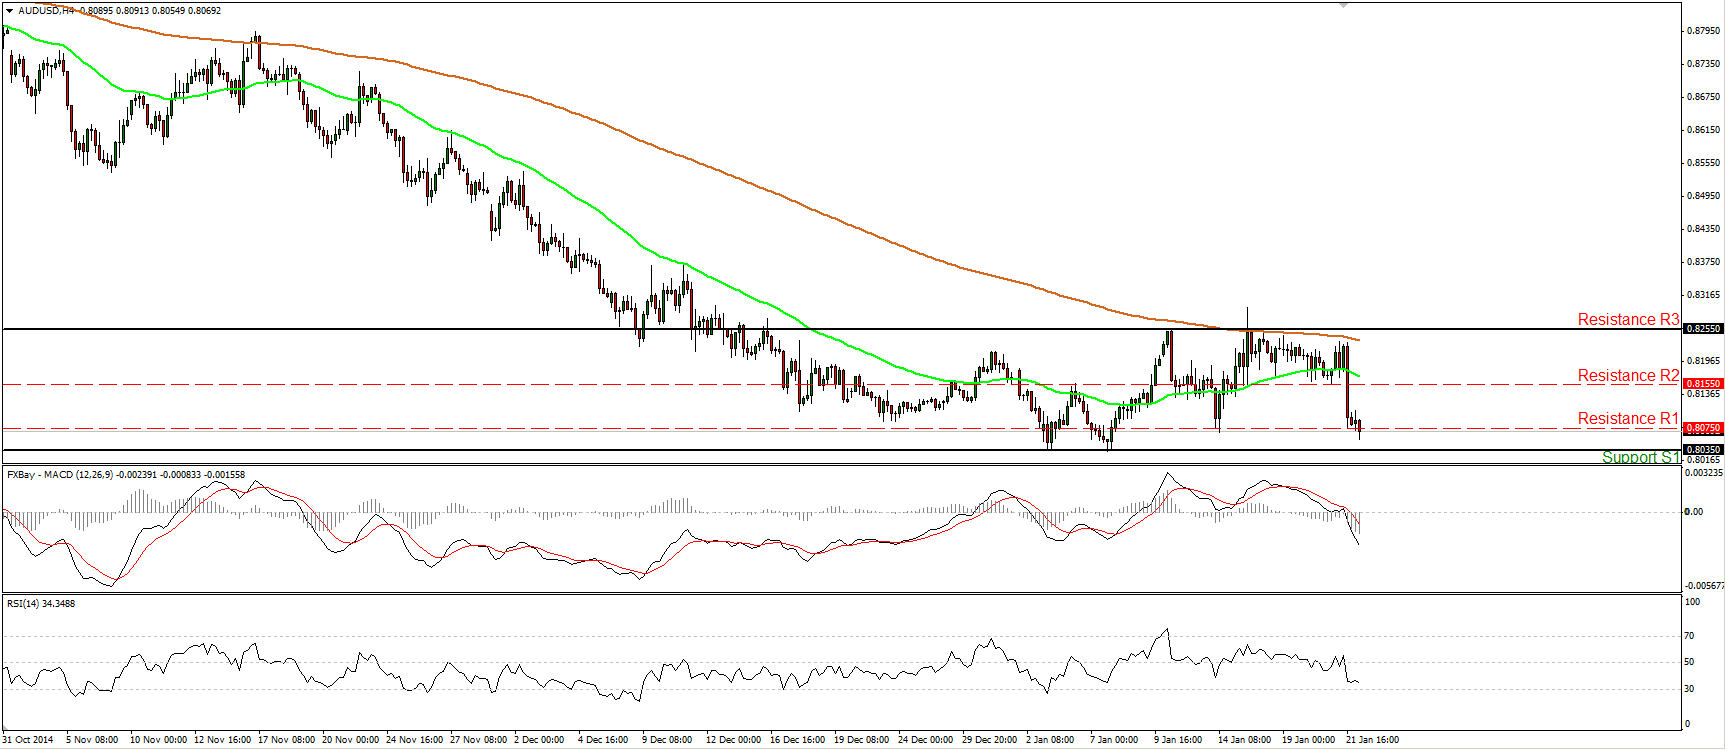
AUD/USD ready to challenge the 0.8035 hurdle
AUD/USD tumbled on Wednesday, breaching the support (turned into resistance) line 0.8075 (R1). I would now expect the rate to challenge the lower bound of the sideways range it’s been trading in since December and subsequently, the psychological figure of 0.8000 (S2). Yesterday’s negative momentum towards AUD/USD is also visible on our momentum indicators. The RSI fell below its 50 line, while the MACD, already below its signal, obtained a negative sign and is now pointing south. As far as the bigger picture is concerned, a break below the 0.8000 (S2) psychological hurdle is the move that could trigger the continuation of the longer-term downtrend. Such a break is likely to see scope for extensions 0.7870 (S3).
• Support: 0.8035 (S1), 0.8000 (S2), 0.7870 (S3).
• Resistance: 0.8075 (R1), 0.8155 (R2), 0.8255 (R3).
Gold takes the 1300 area
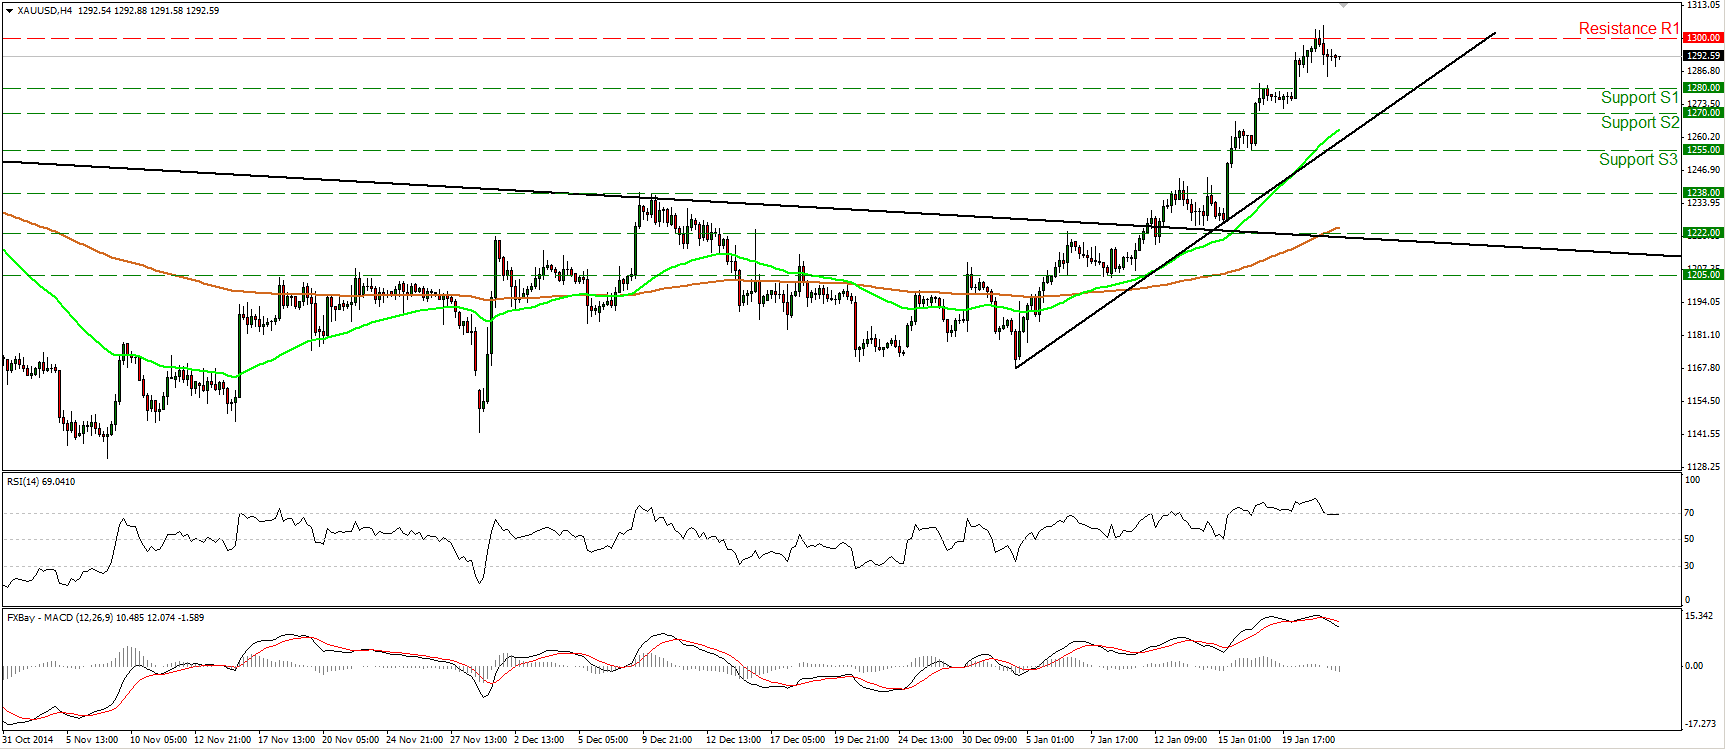
Gold continued racing higher on Wednesday to eventually take the 1300 (R1) psychological territory. A clear and decisive break above that key area is likely to extend the bullish wave of the precious metal and perhaps challenge our next obstacle at 1320 (R2), marked by the high of the 14th of August. Nevertheless, even though I expect the metal to trade higher in the near future, I would be careful of a possible pullback before the bulls seize control again. The RSI just touched its toe below its 70 line, while the MACD has topped and fallen below its zero line. On the daily chart, gold shot up after completing an inverted head and shoulders formation on the 12th of January. The price objective of the formation stands around 1340 (R3).
• Support: 1270 (S1), 1255 (S2), 1238 (S3).
• Resistance: 1300 (R1), 1320 (R2), 1340 (R3).
WTI in a quiet mode
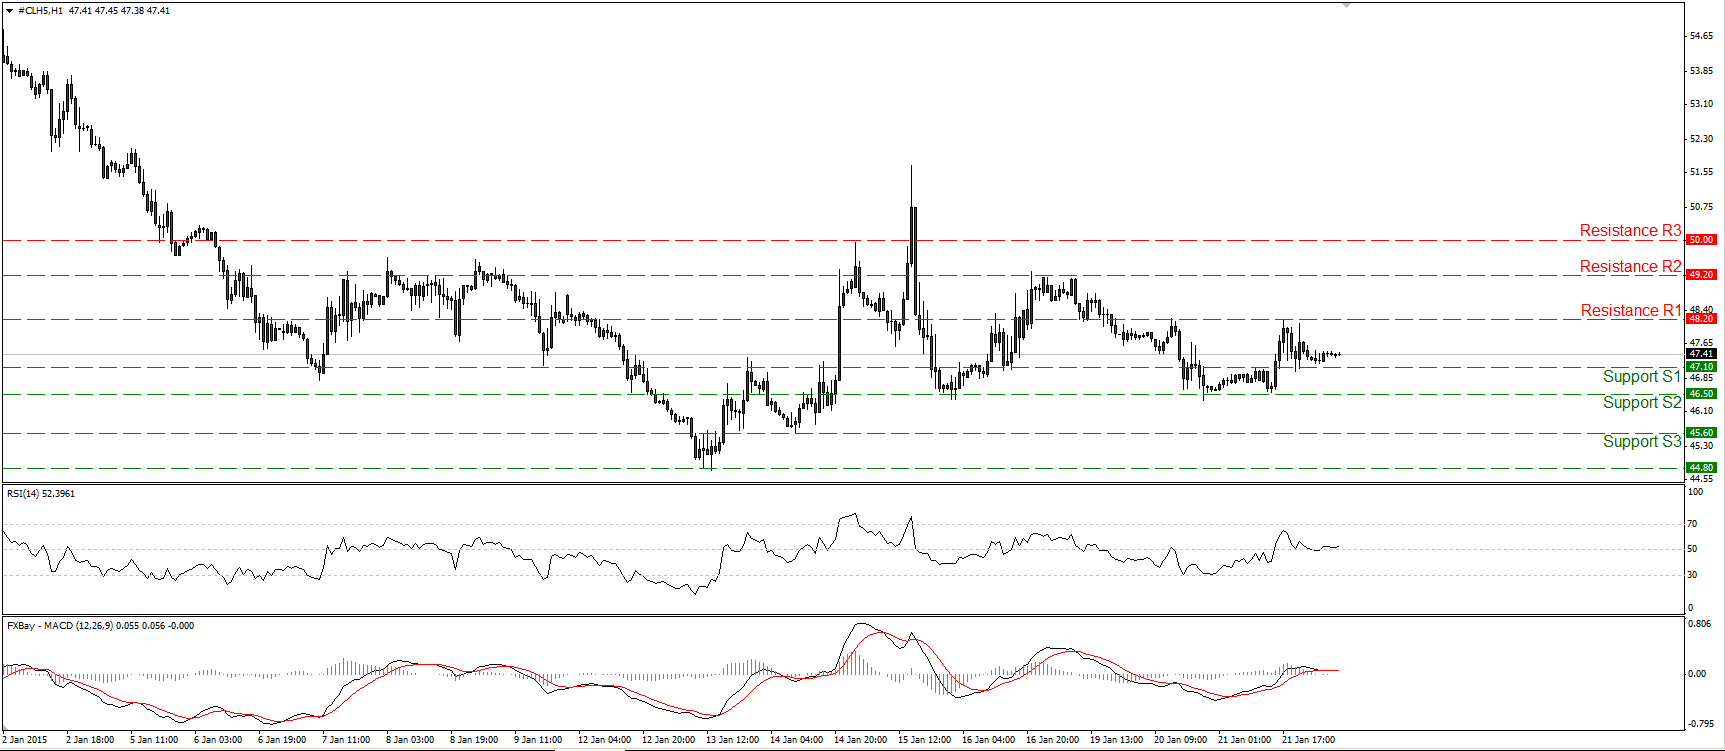
WTI moved in a consolidative mode yesterday, indicating indecision between the participants of the oil market to choose a direction. As a result, with no clear trending conditions in the short-term, I would switch my stance to neutral until I get clearer directional signals. The quiet mode is also reflected on our oscillators. The RSI lies on its 50 line and is pointing sideways, while the MACD stands close to its zero line, staying flat as well. On the daily chart, WTI is still printing lower peaks and lower troughs below both the 50- and the 200-day moving averages, and this keeps the overall downtrend intact. However, since there is still positive divergence between the daily oscillators and the price action, I would prefer to wait for the momentum indicators to confirm the price action before getting confident again about the overall down path.
• Support: 47.10 (S1), 46.50 (S2), 45.60 (S3).
• Resistance: 48.20 (R1), 49.20 (R2), 50.00 (R3) .

