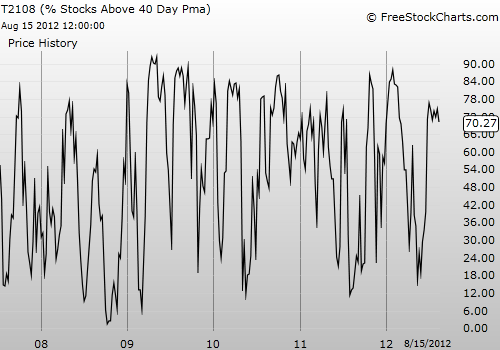
: 70.3% (first day day of FIFTH overbought period since June 29)
VIX Status: 14.6
General (Short-term) Trading Call: Hold. See below for more details.
Commentary
I barely had time to catch my breath after Tuesday’s marginal slide from overbought territory only to find T2108 right back in overbought conditions. I found Tuesday’s fade from the highs and breakout territory quite ironic after having just observed that sellers had yet to hold the S&P 500 at intraday lows throughout the overbought period. (T2108 dropped from 70.5% to 69.3% – a very marginal end to the last overbought period).
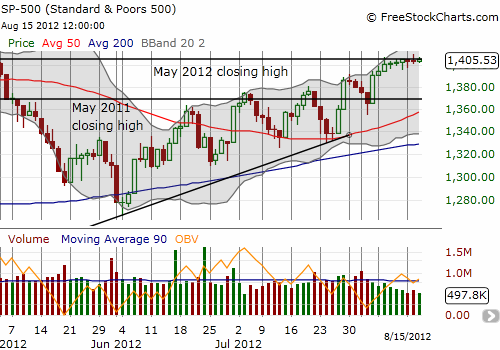
In fact, with a close neatly tucked under the line of resistance formed by the April high, the S&P 500 looked like it had printed a classic fake breakout. Yesterday’s action leaves that signal in doubt.
T2108 is starting its fifth overbought period since the end of June. The fourth overbought period ended quite differently than the previous three. It did not generate a sharp (and profitable) sell-off. In fact, the S&P 500 ended the last overbought period with a slight GAIN. By immediately reverting to overbought status, the market reconfirms its upward bias and upward pressure. The onus remains on the sellers to prove otherwise. The path of least resistance is up.
While we await resolution of this steady drip upward, smart trades are hard to come by. I expect my current crop of ProShares Ultra S&P500 ETF (SSO) puts to go to waste. It is also not quite time to convert my ProShares UltraShort S&P500 ETF (SDS) shares into Active Bear ETF (HDGE) shares (awaiting breakout to fresh multi-year highs).
I do not recommend accumulating a larger bearish position. Since Tuesday’s end of the previous overbought period was so marginal, I am treating the start of the current overbought period as if it is just a continuation of the last one. Definitely initiate a fresh bearish position if you do not have one yet, especially if you continue to ride substantial long positions.
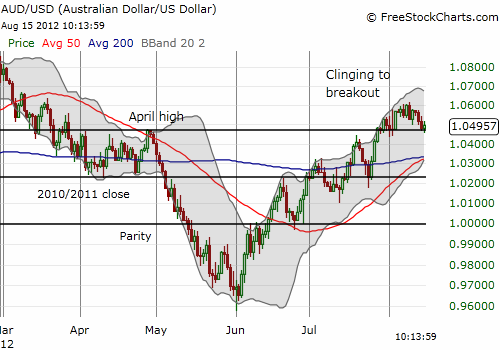
I end with a look at the Australian dollar versus the US dollar (FXA). AUD/USD continues to provide excellent trading signals on the S&P 500. At the time of writing, AUD/USD is right at the edge of resistance turned support from the April, 2012 high. A break here will likely take AUD/USD to the converging 50 and 200DMAs. That will undoubtedly accompany a (small?) sell-off on S&P 500. A bounce to new highs should of course accompany renewed upward momentum on the S&P 500 – to multi-year highs even. Stay tuned!
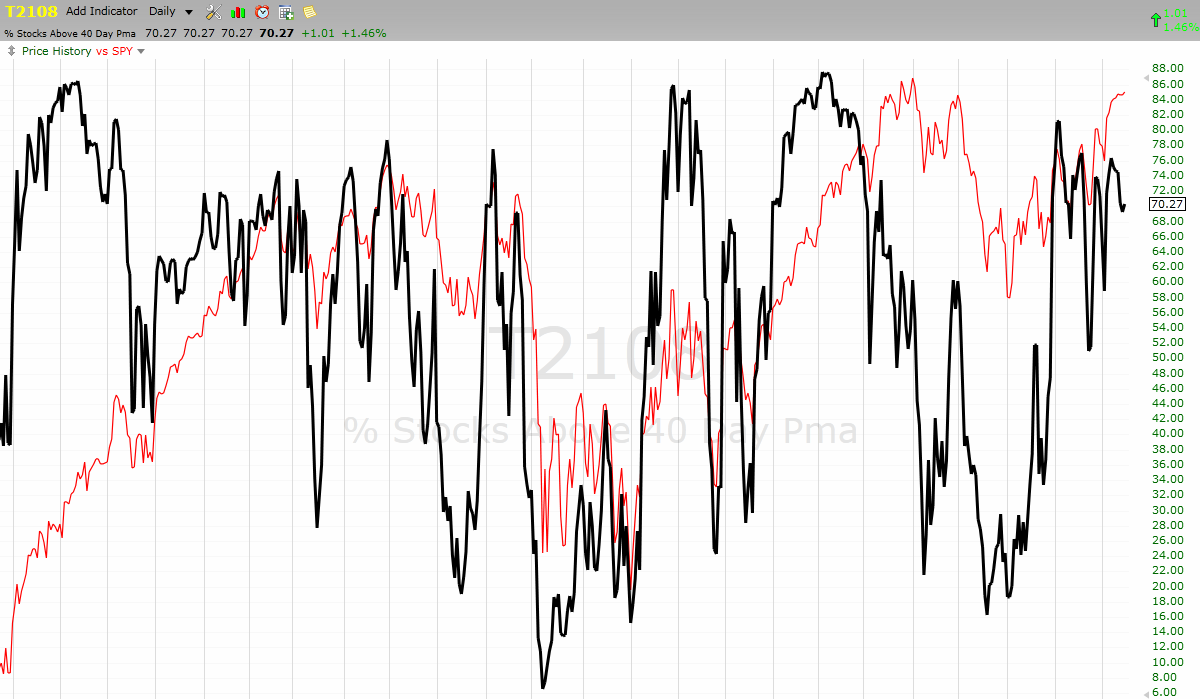
Daily T2108 vs the S&P 500
Click chart for extended view with S&P 500 fully scaled vertically (updated at least once a week)

Be careful out there!
Full disclosure: long SDS; long SSO puts; long VXX shares, calls, and puts; short VXX calls; short AUD/USD
- English (UK)
- English (India)
- English (Canada)
- English (Australia)
- English (South Africa)
- English (Philippines)
- English (Nigeria)
- Deutsch
- Español (España)
- Español (México)
- Français
- Italiano
- Nederlands
- Português (Portugal)
- Polski
- Português (Brasil)
- Русский
- Türkçe
- العربية
- Ελληνικά
- Svenska
- Suomi
- עברית
- 日本語
- 한국어
- 简体中文
- 繁體中文
- Bahasa Indonesia
- Bahasa Melayu
- ไทย
- Tiếng Việt
- हिंदी
Marginal One-Day Rest From Overbought Conditions
Published 08/16/2012, 01:54 AM
Updated 07/09/2023, 06:31 AM
Marginal One-Day Rest From Overbought Conditions
T2108 Status
3rd party Ad. Not an offer or recommendation by Investing.com. See disclosure here or
remove ads
.
Latest comments
Install Our App
Risk Disclosure: Trading in financial instruments and/or cryptocurrencies involves high risks including the risk of losing some, or all, of your investment amount, and may not be suitable for all investors. Prices of cryptocurrencies are extremely volatile and may be affected by external factors such as financial, regulatory or political events. Trading on margin increases the financial risks.
Before deciding to trade in financial instrument or cryptocurrencies you should be fully informed of the risks and costs associated with trading the financial markets, carefully consider your investment objectives, level of experience, and risk appetite, and seek professional advice where needed.
Fusion Media would like to remind you that the data contained in this website is not necessarily real-time nor accurate. The data and prices on the website are not necessarily provided by any market or exchange, but may be provided by market makers, and so prices may not be accurate and may differ from the actual price at any given market, meaning prices are indicative and not appropriate for trading purposes. Fusion Media and any provider of the data contained in this website will not accept liability for any loss or damage as a result of your trading, or your reliance on the information contained within this website.
It is prohibited to use, store, reproduce, display, modify, transmit or distribute the data contained in this website without the explicit prior written permission of Fusion Media and/or the data provider. All intellectual property rights are reserved by the providers and/or the exchange providing the data contained in this website.
Fusion Media may be compensated by the advertisers that appear on the website, based on your interaction with the advertisements or advertisers.
© 2007-2024 - Fusion Media Limited. All Rights Reserved.
