
I understand that Monday was the lowest volume day of the year on ES, and in these low volume doldrums ES tends to inch upwards as it has been doing since Thursday morning. SPX closed almost five points under the daily upper Bollinger Band® Monday, though it’s still in the right area and I’m not seeing that as a significant sign of weakness yet. SPX daily chart: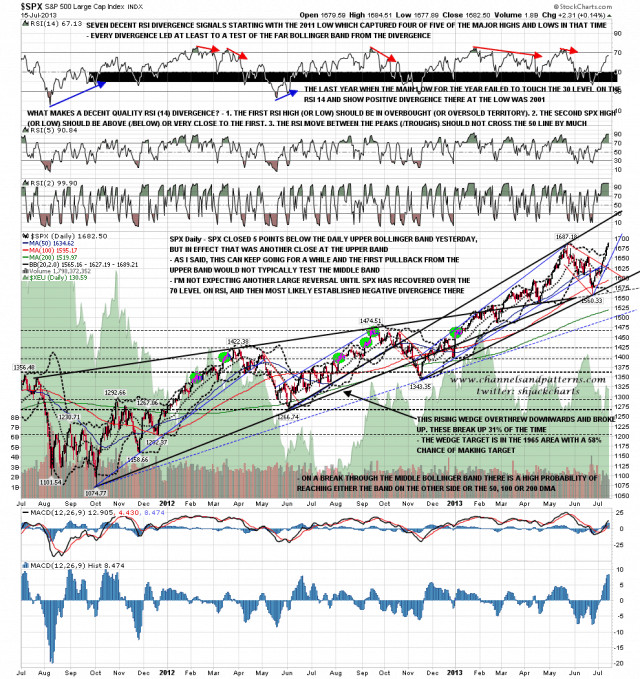
On the SPX 60min chart, rising support from the 1604 low is now in the 1678 area, and I’m expecting to see that tested today. Ideally that would hold and SPX would then hit rising channel resistance in the 1690-5 area before a decent retracement began. My target for that retracement would be rising channel support, currently just under 1655. The 60min RSI is very very overbought and could use a retracement soon. This is the most overbought the SPX 60min RSI has been in 2013 by quite a margin. SPX 60min chart: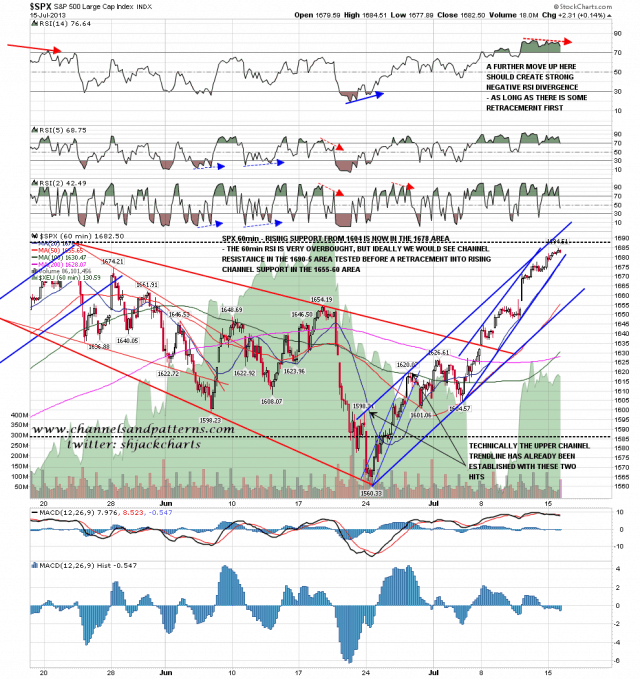
Negative RSI divergence is continuing to build on the ES 60min chart and a rising support trendline has arguably broken, though it isn’t a high quality trendline. As long as ES doesn’t break below the 50 hour MA, currently in the 1684 area, there isn’t a lot to see on the bear side here. ES 60min chart: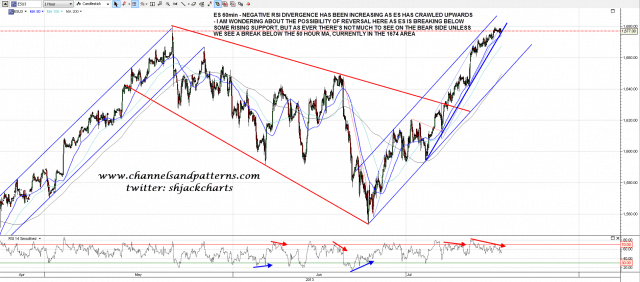
On other market events, I noted Monday at the break of the rising wedge on CL that we might well see a test of the highs before any follow-through downside and well, here we are. We may well see a new high made on CL here and I’ll be watching for signs of the next reversal forming as that could well be a significant decline. CL 60min chart: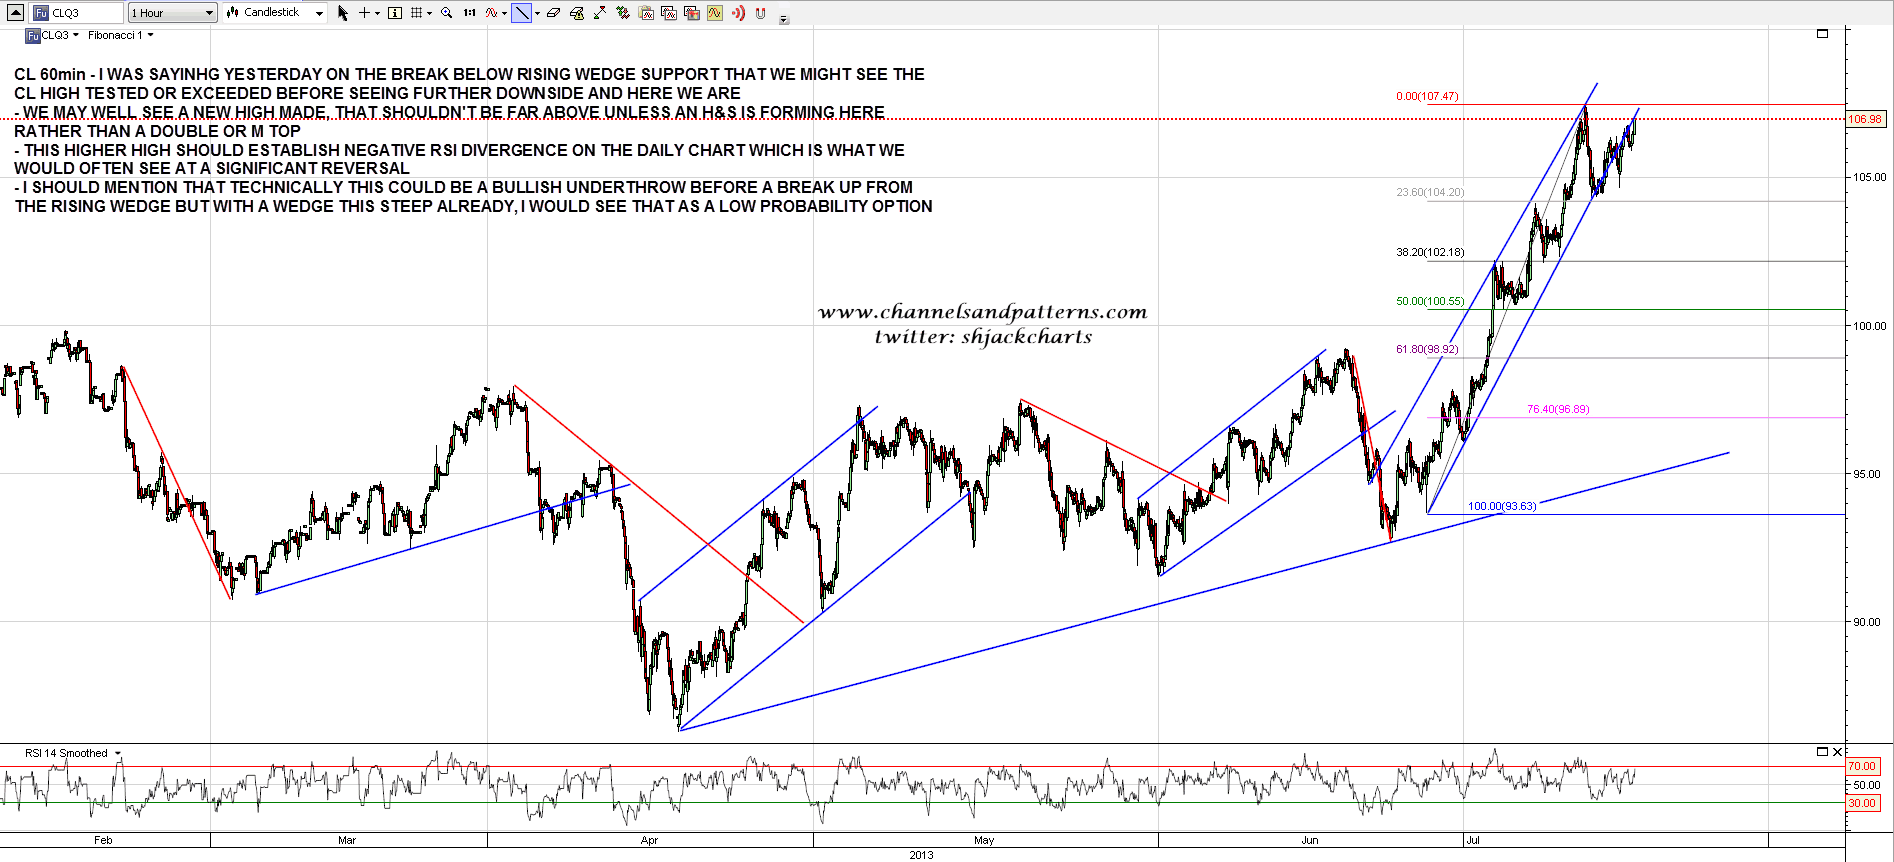
On GBP/USD the retest of broken channel resistance has held and I’m expecting the rally from the current low to go higher. The setup since the current rally high is an encouraging looking bull flag. GBP/USD 60min chart: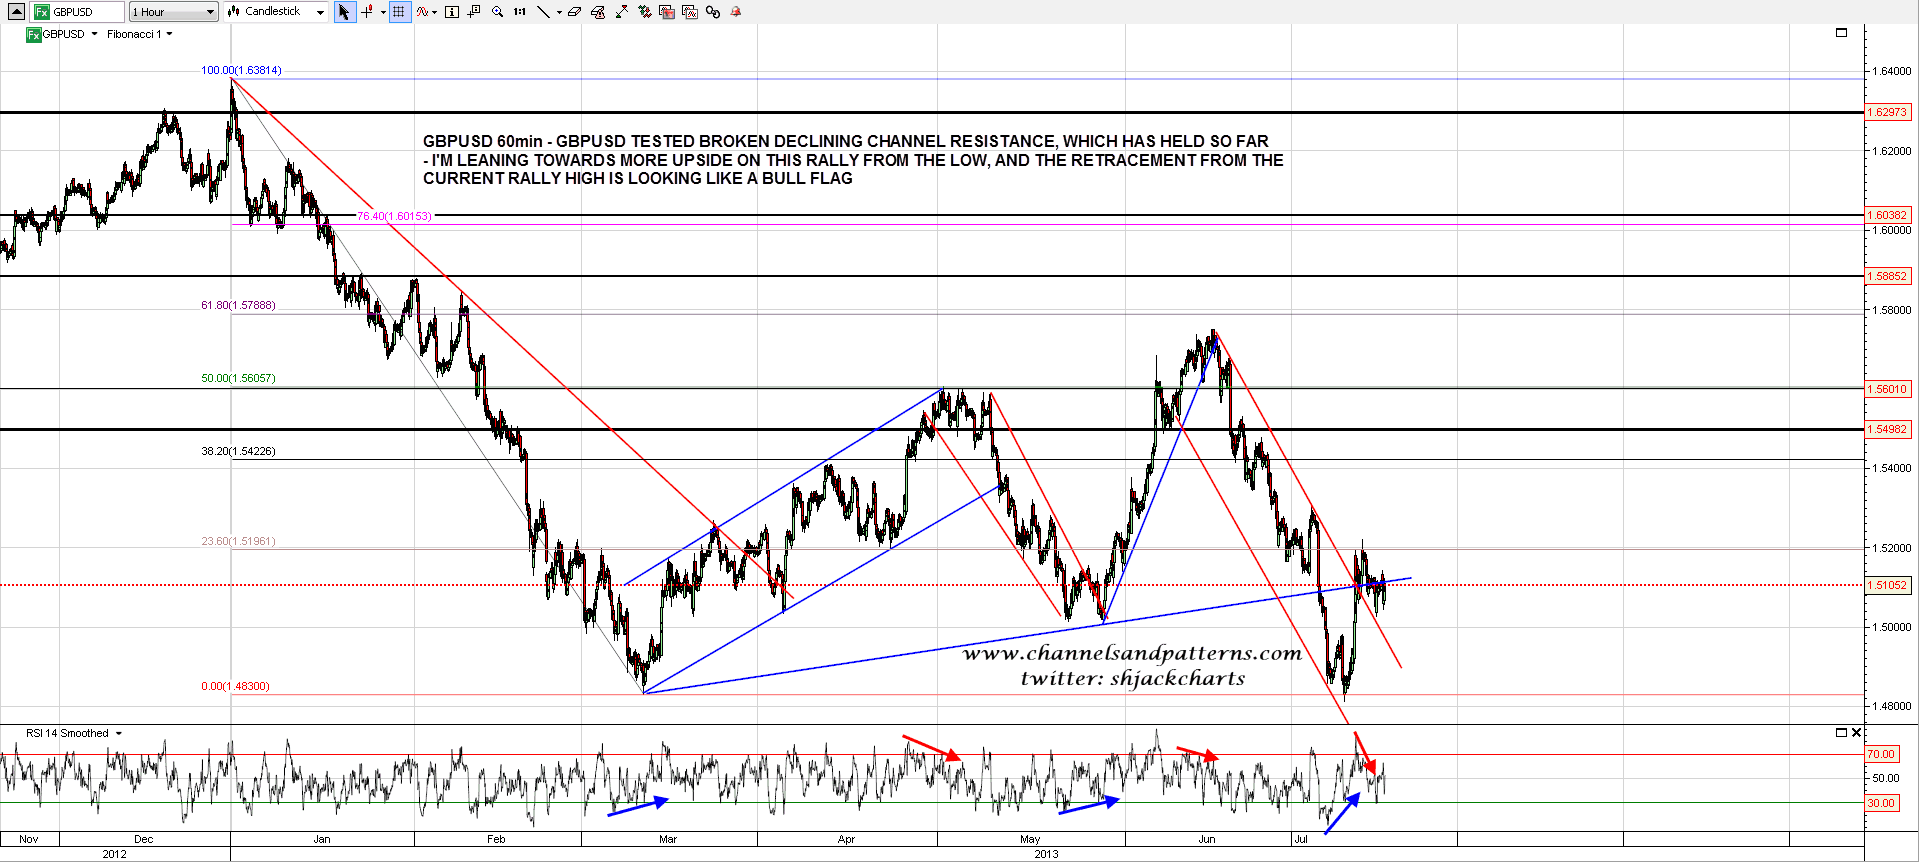 GBP/USD" width="1919" height="862">
I posted the GC chart on twitter Monday and posted the larger version here today. I know a lot of people have called a low on gold already but I’m not convinced. There’s no daily RSI divergence at the current low and GC has not yet reached the obvious target at the 61.8% fib retrace of the 2008-11 wave up. I have GC in a short term declining channel and the next obvious move is a test of declining channel resistance (currently 1350 area) before a reversal downwards to make a marginal new low in the 1135 (GC chart) to 1155 ($Gold chart) area. If we are to see a low on gold anytime soon, that is my highest probability area to see that. GC daily chart: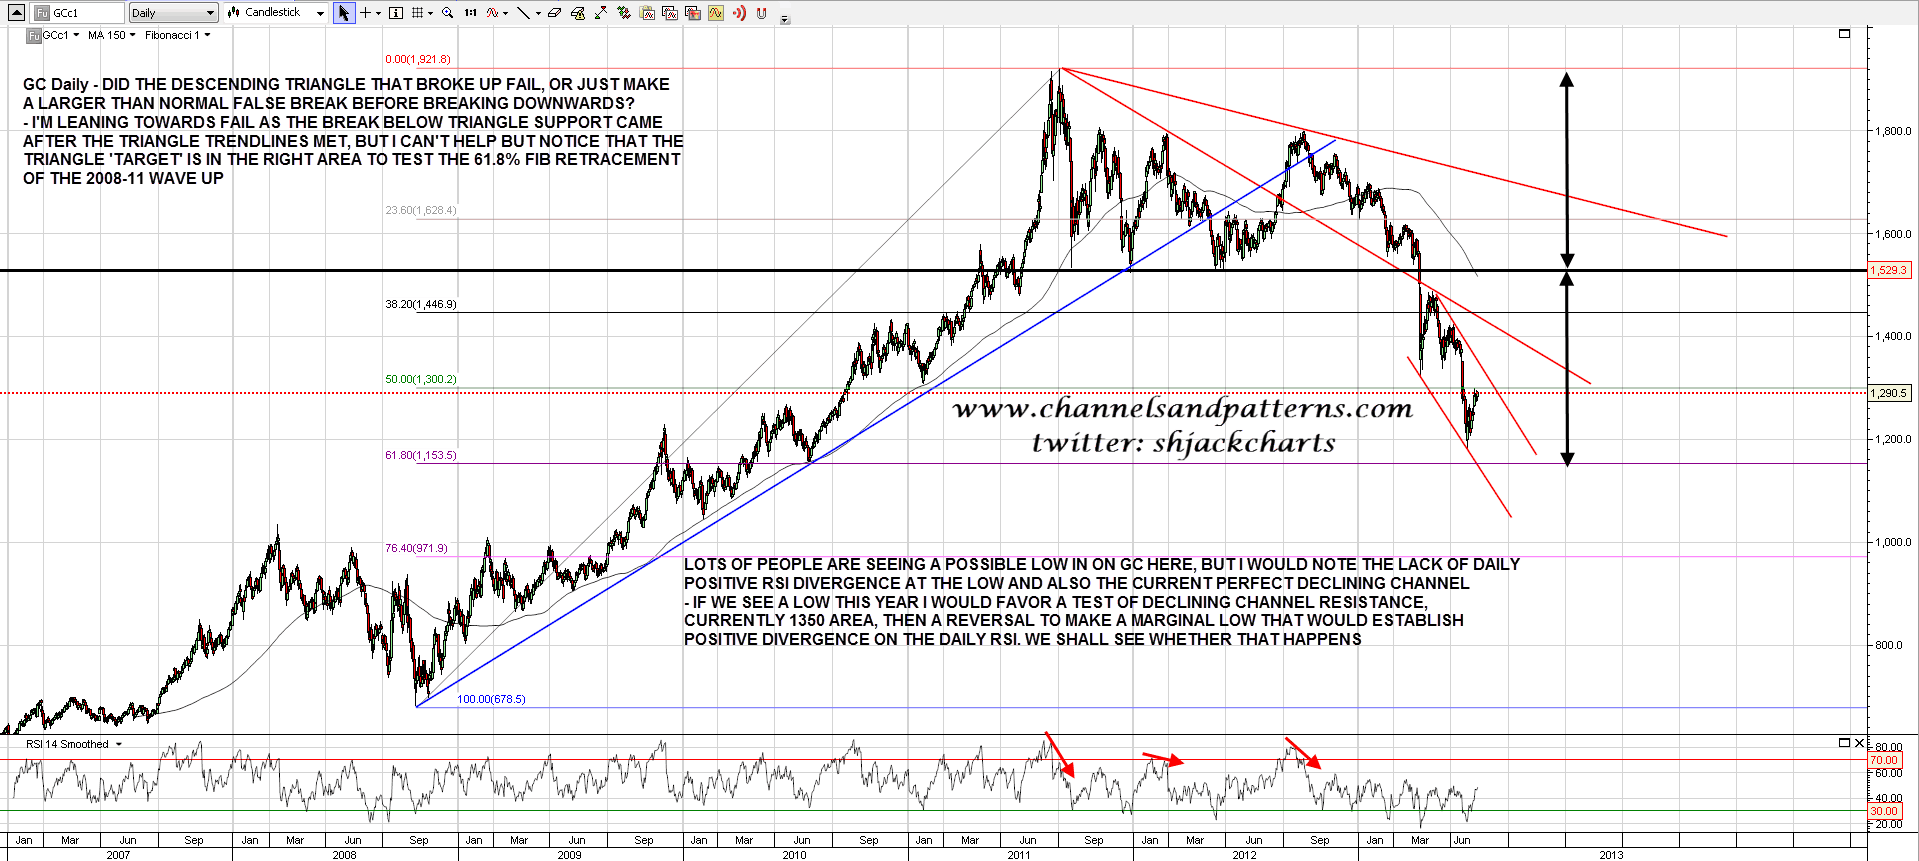
There’s been a decent move up overnight on ZB, and at minimum I’m expecting a test of wedge resistance, currently slightly over 136. RSI is strongly supportive of a break up from this wedge and on a further break over 137 I have the W bottom target just under 142. As I have been mentioning frequently, this could well be the start of a strong rally lasting months on bonds. ZB daily chart: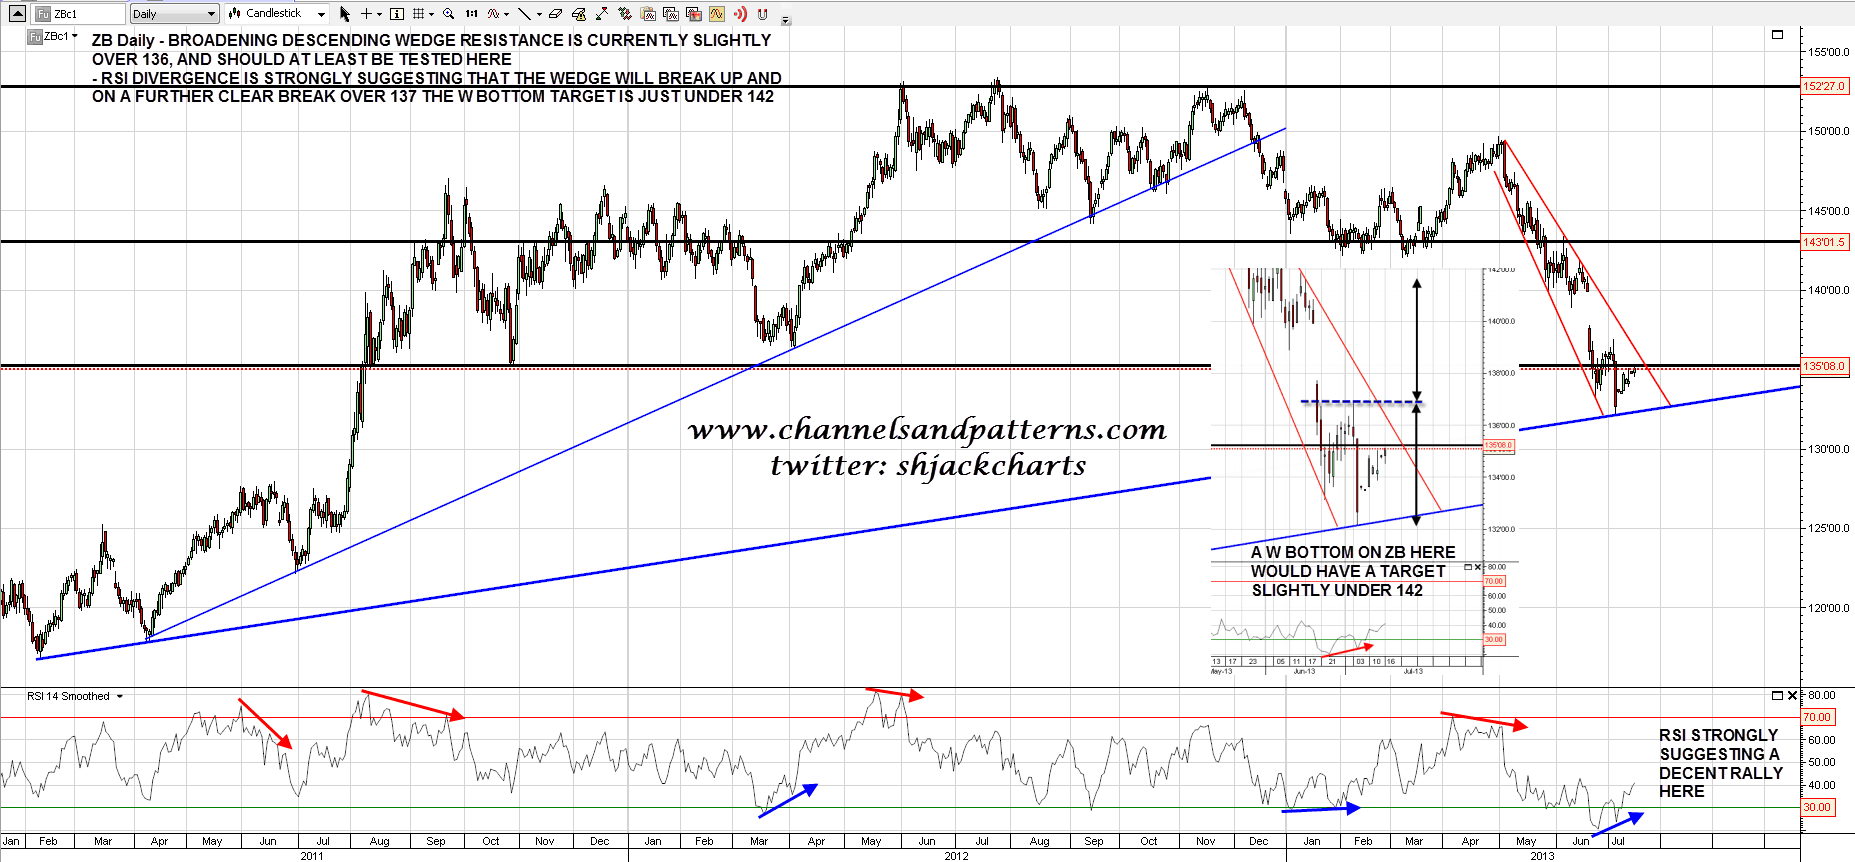
I’m expecting to see a 20-35 point retracement starting this week, though I think ES could rise another ten to fifteen points before we see that. If SPX reaches channel resistance in the 1690-5 area today or tomorrow I’ll be seeing that as a good short entry, albeit I’m not expecting a major top there as I explained Monday. That retracement would relieve the monotony of the last few days. A firm break below the ES 50 hour MA should confirm that retracement is then in progress.
- English (UK)
- English (India)
- English (Canada)
- English (Australia)
- English (South Africa)
- English (Philippines)
- English (Nigeria)
- Deutsch
- Español (España)
- Español (México)
- Français
- Italiano
- Nederlands
- Português (Portugal)
- Polski
- Português (Brasil)
- Русский
- Türkçe
- العربية
- Ελληνικά
- Svenska
- Suomi
- עברית
- 日本語
- 한국어
- 简体中文
- 繁體中文
- Bahasa Indonesia
- Bahasa Melayu
- ไทย
- Tiếng Việt
- हिंदी
Low S&P 500 Volume Crawl, Upwards; No Low On Gold, Yet
Published 07/17/2013, 12:45 AM
Updated 07/09/2023, 06:31 AM
Low S&P 500 Volume Crawl, Upwards; No Low On Gold, Yet
3rd party Ad. Not an offer or recommendation by Investing.com. See disclosure here or
remove ads
.
Latest comments
Install Our App
Risk Disclosure: Trading in financial instruments and/or cryptocurrencies involves high risks including the risk of losing some, or all, of your investment amount, and may not be suitable for all investors. Prices of cryptocurrencies are extremely volatile and may be affected by external factors such as financial, regulatory or political events. Trading on margin increases the financial risks.
Before deciding to trade in financial instrument or cryptocurrencies you should be fully informed of the risks and costs associated with trading the financial markets, carefully consider your investment objectives, level of experience, and risk appetite, and seek professional advice where needed.
Fusion Media would like to remind you that the data contained in this website is not necessarily real-time nor accurate. The data and prices on the website are not necessarily provided by any market or exchange, but may be provided by market makers, and so prices may not be accurate and may differ from the actual price at any given market, meaning prices are indicative and not appropriate for trading purposes. Fusion Media and any provider of the data contained in this website will not accept liability for any loss or damage as a result of your trading, or your reliance on the information contained within this website.
It is prohibited to use, store, reproduce, display, modify, transmit or distribute the data contained in this website without the explicit prior written permission of Fusion Media and/or the data provider. All intellectual property rights are reserved by the providers and/or the exchange providing the data contained in this website.
Fusion Media may be compensated by the advertisers that appear on the website, based on your interaction with the advertisements or advertisers.
© 2007-2024 - Fusion Media Limited. All Rights Reserved.