The shiny yellow rock is like the Sybil of the investment world. It has at least seven personalities. Some see it as an inflation hedge. Others a currency. Some see it as a fear gauge and still others see it as a luxury retail item.
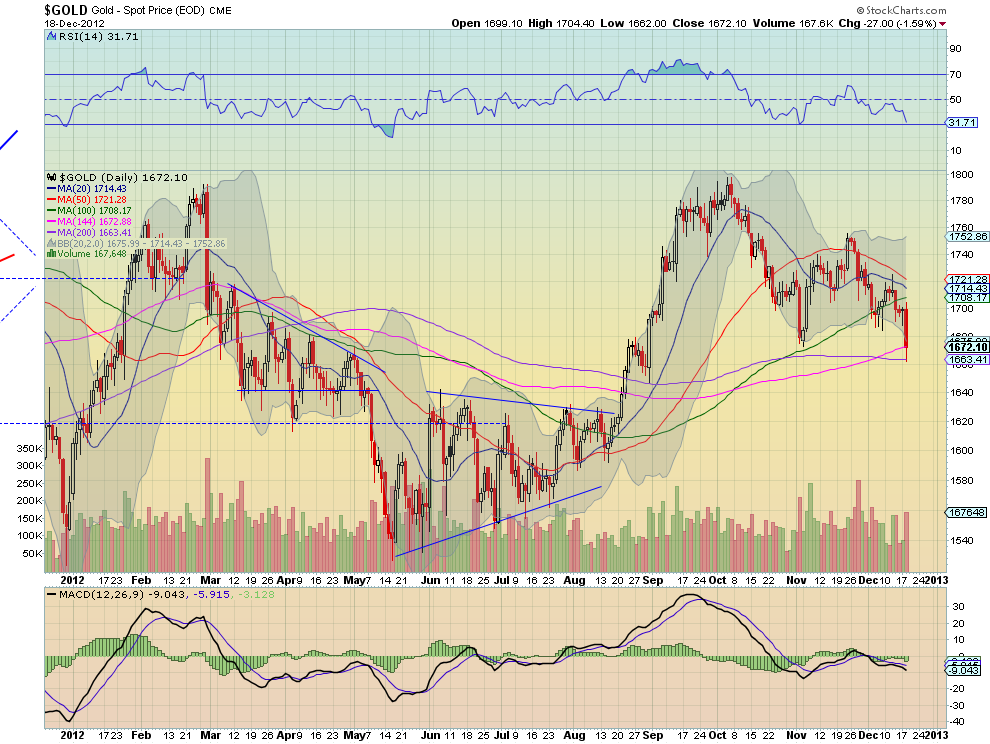
So which is it? All of these and then some. And that is what can make it interesting as a trading vehicle. Let’s see what the charts are saying about this nugget. The daily chart is making news so let’s start there. The chart below shows a pullback to the 200 day Simple Moving Average (SMA) for the first time since late August. This comes with the shorter 20 and 50 day SMA’s rolling over and price on the way back from a double top at 1800. 
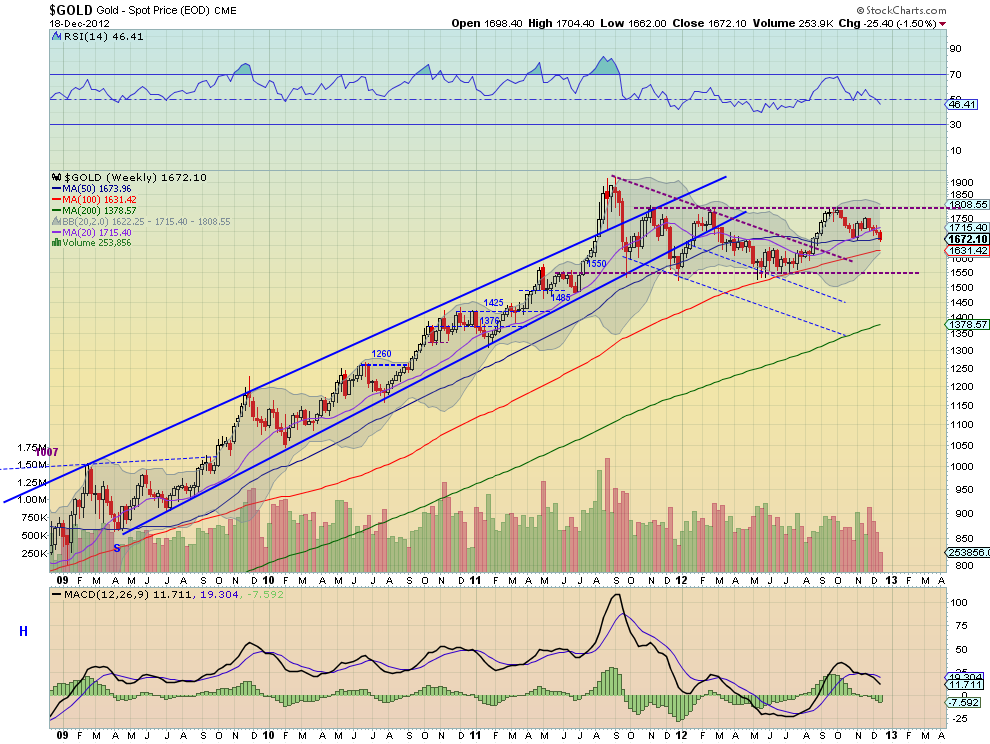
The falling and bearish Relative Strength Index (RSI) and negative Moving Average Convergence Divergence indicator (MACD) both support a continued move lower. A lower low from a lower high signals at least caution but watch for a break of that 200 day SMA to open it to lower support at 1640 and 1620 followed by 1600. Moving out to the weekly view shows the 50 week SMA splitting a neutral channel between 1550 and 1800. It also has a RSI that is pointing lower as it is making a new lower low and heading towards bearish territory and a negative MACD supporting that case. It is still early in the week, but watch the volume as it has been declining on this pullback.
Should it continue, then it raises thoughts of a slowing and reversal. A move below 1660 on this view triggers a target of 1520, on the break of the descending triangle. A bias lower on this timeframe but not as gruesome as the daily.
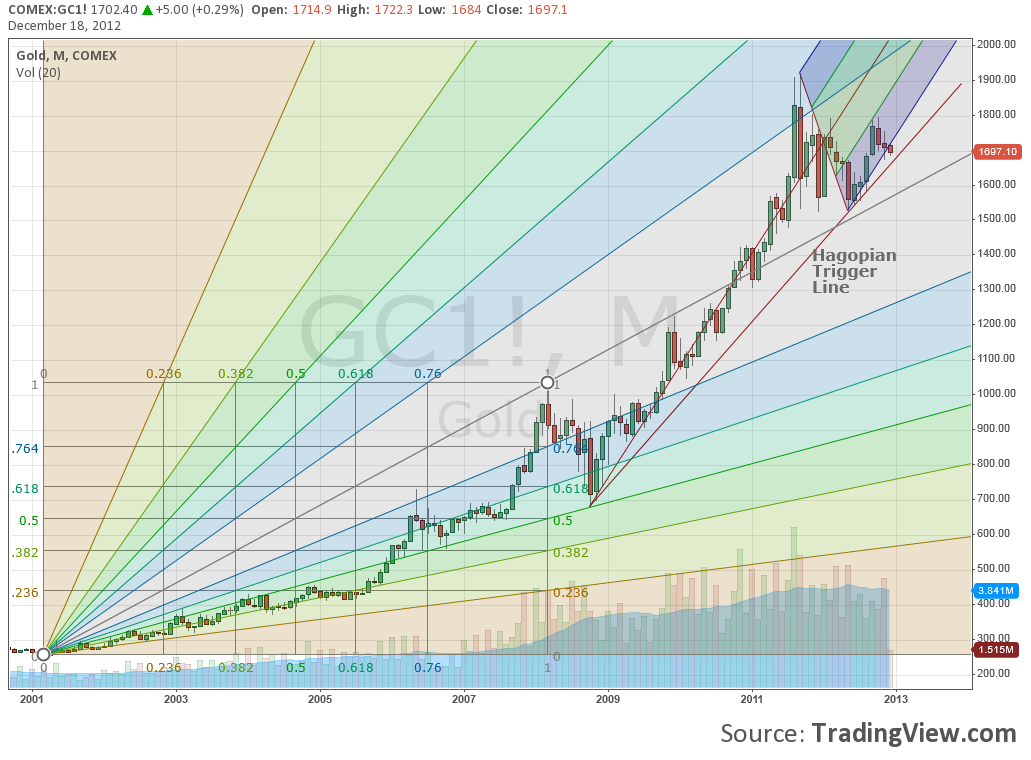
Stepping back further to the monthly chart shows the long trend higher from 2001, holding above the 100% Fibonacci Fan after being set back at a test of the next Fan line higher. This is very bullish. The shorter view from 2008 shows the price breaking below the lower Median Line of the Andrew’s Pitchfork and nearing the Hagopian Trigger Line (a short signal). 
This is getting complicated. If it falls under the trigger at 1660 this month, then there is support at 1550 and then nothing until 1500 and 1420. from there it can get ugly. A 50% retracement of the 12 year up movement for example is at 1089 but lets not get ahead of ourselves.
In summary, the 12 year uptrend in Gold looks to be in jeopardy for the first time. The key levels to watch that could lead to a cascade lower are 1640-1660 followed by 1550.
This is the seventh in a series of A Long Term View On …. articles that will appear over the next few weeks.
Disclosure: The information in this blog post represents my own opinions and does not contain a recommendation for any particular security or investment. I or my affiliates may hold positions or other interests in securities mentioned in the Blog, please see my Disclaimer page for my full disclaimer.
Original post
- English (UK)
- English (India)
- English (Canada)
- English (Australia)
- English (South Africa)
- English (Philippines)
- English (Nigeria)
- Deutsch
- Español (España)
- Español (México)
- Français
- Italiano
- Nederlands
- Português (Portugal)
- Polski
- Português (Brasil)
- Русский
- Türkçe
- العربية
- Ελληνικά
- Svenska
- Suomi
- עברית
- 日本語
- 한국어
- 简体中文
- 繁體中文
- Bahasa Indonesia
- Bahasa Melayu
- ไทย
- Tiếng Việt
- हिंदी
Long Term View Of Gold
Published 12/20/2012, 12:37 AM
Updated 05/14/2017, 06:45 AM
Long Term View Of Gold
3rd party Ad. Not an offer or recommendation by Investing.com. See disclosure here or
remove ads
.
Latest comments
Install Our App
Risk Disclosure: Trading in financial instruments and/or cryptocurrencies involves high risks including the risk of losing some, or all, of your investment amount, and may not be suitable for all investors. Prices of cryptocurrencies are extremely volatile and may be affected by external factors such as financial, regulatory or political events. Trading on margin increases the financial risks.
Before deciding to trade in financial instrument or cryptocurrencies you should be fully informed of the risks and costs associated with trading the financial markets, carefully consider your investment objectives, level of experience, and risk appetite, and seek professional advice where needed.
Fusion Media would like to remind you that the data contained in this website is not necessarily real-time nor accurate. The data and prices on the website are not necessarily provided by any market or exchange, but may be provided by market makers, and so prices may not be accurate and may differ from the actual price at any given market, meaning prices are indicative and not appropriate for trading purposes. Fusion Media and any provider of the data contained in this website will not accept liability for any loss or damage as a result of your trading, or your reliance on the information contained within this website.
It is prohibited to use, store, reproduce, display, modify, transmit or distribute the data contained in this website without the explicit prior written permission of Fusion Media and/or the data provider. All intellectual property rights are reserved by the providers and/or the exchange providing the data contained in this website.
Fusion Media may be compensated by the advertisers that appear on the website, based on your interaction with the advertisements or advertisers.
© 2007-2024 - Fusion Media Limited. All Rights Reserved.
