London Forex Report: Oil prices dropped below the USD 40/barrel threshold after Iran’s announcement that output will be raised to 4 million barrels a day before joining talks to freeze production, increasing concern over supply glut. Overnight, crude oil prices fell to USD 39.5/barrel. Tone of RBA March minutes was slightly dovish, highlighting renewed concerns on volatility in financial markets caused by BOJ’s recent decision to implement negative interest rates. The minutes indicated that domestic growth was slightly below trend, reinforcing expectation that the central bank will act should economic conditions deteriorate.USD strengthened driven by demand from risk-off in FX space as well as renewed weakness in commodities. The USD Index climbed steadily at the start of European trade and closed 0.46% higher at 96.62
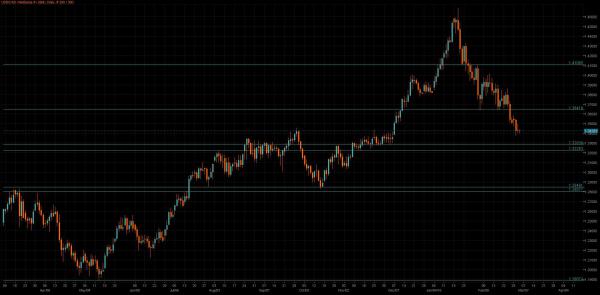
EUR/USD
Outlook: Short Term (1-3 Days): Neutral – Medium Term (1-3 Weeks): Bearish
Fundamental: EUR continued to grind lower as traders took profits from a surge that followed European Central Bank head Mario Draghi’s hints that the bank may not continue easing monetary policy. The Euro posted its largest monthly gain after Draghi’s remarks last Thursday, but now the sentiment has shifted to more fundamentals-oriented view.
Technical: Intraday support is sited at 1.1060/40 while this survives expect a further grind higher to test pivotal resistance at 1.1370. Failure at 1.10 suggests false break and opens retest of bids towards 1.0820
Interbank Flows: Bids 1.1050 stops below. Offers 1.13 stops above.
Retail Sentiment: Neutral
Trading Take-away: Neutral
GBP/USD
Outlook: Short Term (1-3 Days): Neutral – Medium Term (1-3 Weeks): Bearish
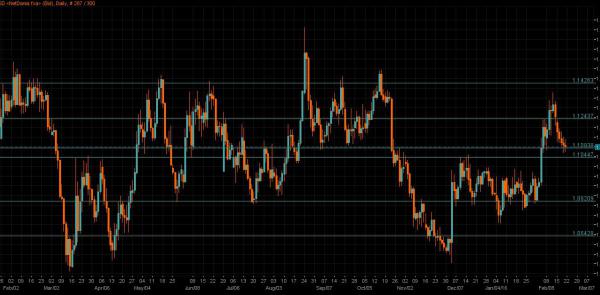
Fundamental: GBP retreated from the one-month high 1.4435 to its current level of 1.4276, weakened due to the falling oil prices which overturned rallies in nearly all commodities currencies. Shrugging off the Brexit referendum on June, GBP/USD surged from lows of 1.3830 to last Friday high of 1.4435. However, this should be viewed as technical rebound as the fundamentals remain unchanged.
Technical: 1.4424 corrective objective achieved, Profit taking pull back should find renewed buying interest towards 1.4280 setting a platform to challenge 1,4570 offers as the next upside objective . A failure at 1.42 opens a retest of bids towards 1.41
Interbank Flows: Bids 1.4250 stops below. Offers 1.4450 stops above
Retail Sentiment: Neutral
Trading Take-away: Neutral
USD/JPY
Outlook: Short Term (1-3 Days): Bearish – Medium Term (1-3 Weeks): Bearish
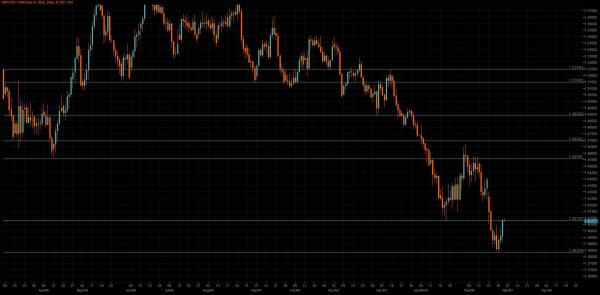
Fundamental: As anticipated, the BOJ has chosen to keep its extra-loose policy unchanged, but not before some heightened volatility in the USD/JPY market pre-announcement. The pair prints a high of 114.17 before tracking towards the initial support level of 113.30 (at the time of writing), after which at 112.70/80.
Technical: 112.30/10 continues to support expect a further leg of corrective gains, to retest the broken neckline support at 115/116. Failure at 112 open 11 again.
Interbank Flows: Bids 112.50 offers below. Offers 114.50 stops above
Retail Sentiment: Bullish
Trading Take-away: Sidelines
EUR/JPY
Outlook: Short Term (1-3 Days): Neutral – Medium Term (1-3 Weeks): Bearish
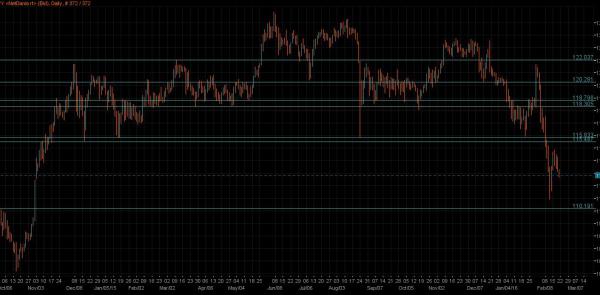
Fundamental: Eurozone’s industrial production staged a surprised 2.1% MoM increase in Jan, snapping two straight monthly declines. The rebound in output was driven by growth in capital goods (+3.4%), energy (+2.4%) and non- durable consumer goods (+2.4%) production. In Dec, output fell 0.5% MoM. On an annual basis, IPI grew 2.8% in Jan after a 0.1% YoY contraction in Dec.
Technical: While 125 acts as support for the current advance expect a test of symmetry resistance at 128.15 as the immediate corrective objective. Failure at 124.50 suggest false upside break and opens retest of 123
Interbank Flows: Bids 125 stops below. Offers 127.50 stops above
Retail Sentiment: Bullish
Trading Take-away: Sidelines
AUD/USD
Outlook: Short Term (1-3 Days): Bullish – Medium Term (1-3 Weeks): Bullish
Fundamental: Aussie has been under pressure today breaking fresh lows seen in the NY session. The RBA minutes really had very little in them, Australia is likely to maintain its recent spurt of hiring, while weak wage growth also provides scope to cut interest rates further, but the pair couldn’t manage to rally and it seems that further profit taking is being seen in front of the FOMC.
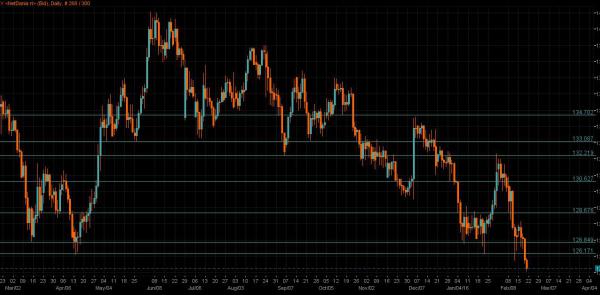
Technical: While .7400 supports intraday expect further upside pressure targeting .7672 next. Only a failure at.7300 support threatens near term bullish bias
Interbank Flows: Bids .7400 stops below. Offers .7600 stops above
Retail Sentiment: Bearish
Trading Take-away: Long
USD/CAD
Outlook: Short Term (1-3 Days): Bearish – Medium Term (1-3 Weeks): Bearish
Fundamental: USD/CAD managed to regain the 1.3200 handle with a softer tone in crude oil prices, and tested 1.3300 barrier overnight. The April contract for benchmark North American crude oil slumped $1.32 to US$37.18 a barrel after Iran’s oil minister dismissed the idea of a production cap, saying the country will keep increasing output until it reaches pre-sanctions levels of four million barrels a day.
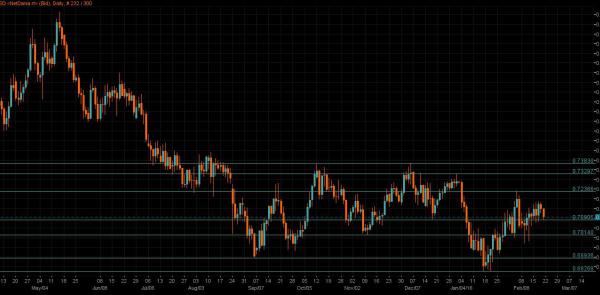
Technical: While 1.3400 contains the recovery, downside pressure remains the driver with bears focusing on a AB=CD ultimate downside objective at 1.2966. Only a close over 1.3650 negates the bearish bias.
Interbank Flows: Bids 1.3150 stops below. Offers 1.3350 stops above
Retail Sentiment: Bullish
Trading Take-away: Short
