Natural gas becomes a liquid when chilled to -260 degrees, allowing exporters to pack the liquefied product onto specialized carriers for delivery to overseas import terminals.
LNG frees gas from the physical constraints of the global pipeline system. Before the widespread commercialization of LNG technology, natural gas located far offshore or in remote areas was considered stranded and had no economic value because producers couldn’t deliver output to consumers. LNG allows natural gas produced in Australia or offshore West Africa to high-demand markets such as Europe and Asia.
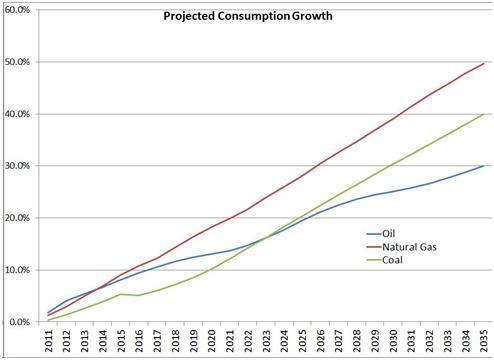
Global consumption of natural gas should grow at a faster pace than any other fossil fuel in coming years, according to projections from the US Energy Information Administration (EIA).
Whereas the EIA expects global demand for natural gas to surge almost 50 percent between 2010 and 2035, oil demand is expected to grow by 30 percent and coal demand is expected to jump by 40 percent.
This forecast appears conservative relative to industry estimates. For example, ExxonMobil Corp (NYSE: XOM) expects global gas demand to increase at an annualized pace of 1.6 percent over the next 30 years, compared to a 0.9 percent annualized growth rate for aggregate energy demand.
In either case, there’s a good chance that natural gas will overtake coal as the world’s second-largest source by the middle of the coming decade. Two factors will fuel this paradigm shift: Natural gas is more plentiful than oil and burns cleaner than oil or coal.
The global LNG trade continues to grow at a faster pace than both overall demand for natural gas and volumes transported by pipeline. In 2005 LNG accounted for about 26 percent of the 722 billion cubic meters of natural gas that exchanged hands in the global market. By 2010, global trade in natural gas had surged to more than 975 billion cubic meters; LNG accounted for about 31 percent of the market.
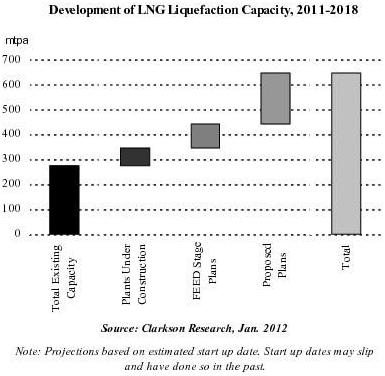
With a number of liquefaction projects slated for completion over the next few years, the global LNG trade should expand substantially over the next few years. At the end of 2011, global LNG export capacity stood at about 275 million metric tons per annum; plants currently under construction will expand global capacity by about 25 percent, while capacity could surge to 650 million metric tons per annum in 2018 if all the planned or proposed projects come to fruition.
That being said, a number of the proposed LNG export terminals likely won’t be built, while delays should push out the completion date of a number projects that are currently under construction. Even with these inevitable slippages, global liquefaction capacity should increase substantially in the next few years.
Investors must distinguish between the North American market and international markets for natural gas. The frenzied development of the Marcellus Shale in Appalachia, the Haynesville Shale in Louisiana and other unconventional plays has glutted the US market. As I stated previously, with production still likely to outpace demand, US natural gas prices should remain depressed for at least the next two to three years.
With domestic natural gas prices hovering near record lows, some US-based investors overlook the growth opportunities in international markets for natural gas. Utility stocks and other major gas consumers in Europe and Asia lack rapidly growing domestic supplies of natural gas and rely heavily on imports to meet supply.
Natural gas has been growing in popularity in China, particularly in power-generation facilities located near major cities. Concerns about air quality mean that many of the high-rise residences constructed during China’s recent housing boom are equipped for piped gas. Further migration to urban areas will only increase demand.
Even after China’s annual consumption of natural gas more than tripled between 2000 and 2009, this extraordinary growth shows no signs of abating. The National Development and Reform Commission (NDRC) estimates that in the first 10 months of 2011, domestic natural gas demand surged to 3,676 billion cubic feet (bcf)–up 20.4 percent from year-ago levels. Meanwhile, energy companies in China produced only 2,916 bcf of natural gas over the same period, an increase of 6.6 percent. To offset this shortfall, the country’s imports soared by 86.5 percent, to 904 billion cubic feet.
LNG accounted for about half China’s imports in the first 10 months of 2011; these volumes are expected to grow substantially in coming years. Check out Shale Oil and Gas in China for more analysis on investing in this trend.
Meanwhile, Japan and South Korea, which is cut off from Asia’s pipeline network by North Korea, import the majority of their natural gas via LNG tankers. With many of its nuclear reactors still shuttered for evaluation and maintenance, Japan’s LNG imports remain near record highs.
Additionally, Germany’s decision to close all its nuclear power plants over the next 10 years likewise bodes well for activity in the global LNG market.
- English (UK)
- English (India)
- English (Canada)
- English (Australia)
- English (South Africa)
- English (Philippines)
- English (Nigeria)
- Deutsch
- Español (España)
- Español (México)
- Français
- Italiano
- Nederlands
- Português (Portugal)
- Polski
- Português (Brasil)
- Русский
- Türkçe
- العربية
- Ελληνικά
- Svenska
- Suomi
- עברית
- 日本語
- 한국어
- 简体中文
- 繁體中文
- Bahasa Indonesia
- Bahasa Melayu
- ไทย
- Tiếng Việt
- हिंदी
LNG: A Bright Spot In Natural Gas Markets
Published 03/26/2012, 10:40 AM
Updated 07/09/2023, 06:31 AM
LNG: A Bright Spot In Natural Gas Markets
Latest comments
Loading next article…
Install Our App
Risk Disclosure: Trading in financial instruments and/or cryptocurrencies involves high risks including the risk of losing some, or all, of your investment amount, and may not be suitable for all investors. Prices of cryptocurrencies are extremely volatile and may be affected by external factors such as financial, regulatory or political events. Trading on margin increases the financial risks.
Before deciding to trade in financial instrument or cryptocurrencies you should be fully informed of the risks and costs associated with trading the financial markets, carefully consider your investment objectives, level of experience, and risk appetite, and seek professional advice where needed.
Fusion Media would like to remind you that the data contained in this website is not necessarily real-time nor accurate. The data and prices on the website are not necessarily provided by any market or exchange, but may be provided by market makers, and so prices may not be accurate and may differ from the actual price at any given market, meaning prices are indicative and not appropriate for trading purposes. Fusion Media and any provider of the data contained in this website will not accept liability for any loss or damage as a result of your trading, or your reliance on the information contained within this website.
It is prohibited to use, store, reproduce, display, modify, transmit or distribute the data contained in this website without the explicit prior written permission of Fusion Media and/or the data provider. All intellectual property rights are reserved by the providers and/or the exchange providing the data contained in this website.
Fusion Media may be compensated by the advertisers that appear on the website, based on your interaction with the advertisements or advertisers.
© 2007-2024 - Fusion Media Limited. All Rights Reserved.
