Litecoin Gann and Ichimoku Analysis Critical levels for Litecoin (LTC) using Gann and the Ichimoku Kino Hyo system.
Litecoin Daily Chart

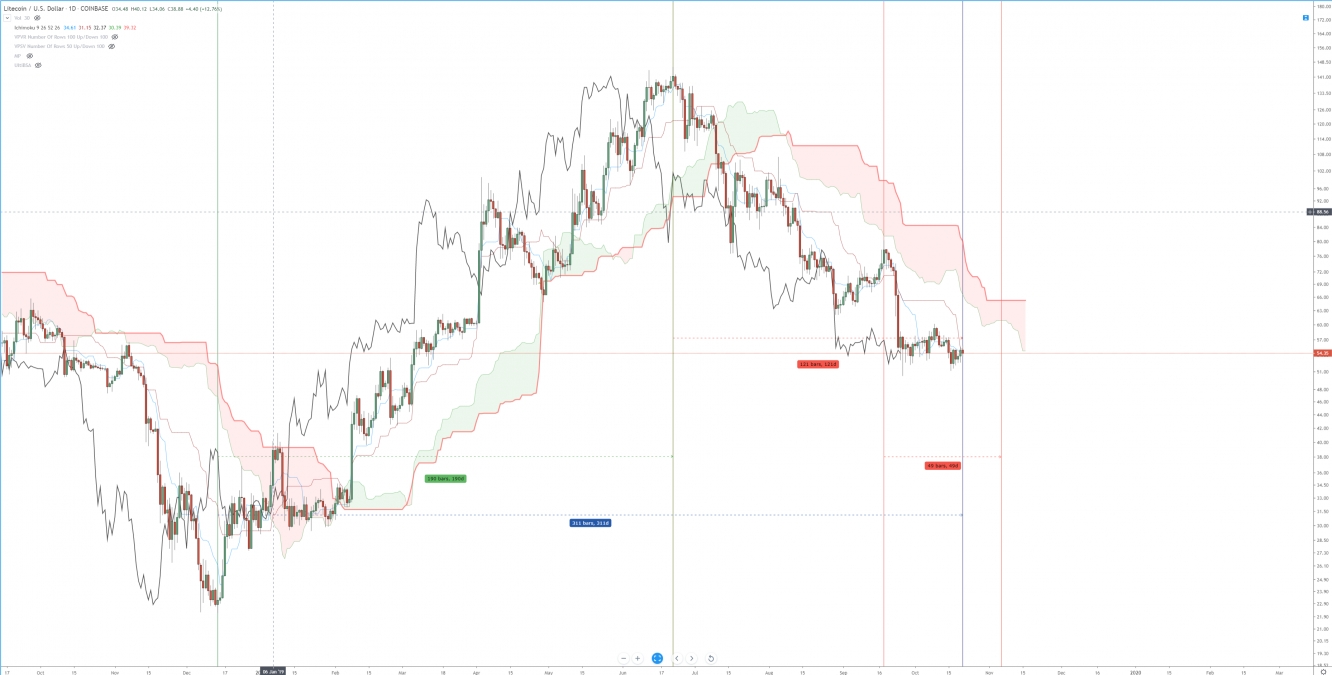
Litecoin has one hell of a bearish looking daily chart. Litecoin first dropped below the Kumo on July 10th, 2019, with an ideal short signal generated when both price and the Chikou Span were below the Kumo on July 16th, 2019. Ever since that significant short signal developed, Litecoin has followed the rest of the crypto market by dropping lower – Litecoin has lost over -65% of its value from the June 2019 high. There has only been one incident of price testing the bottom of the Kumo, and that was back on September 18th, 2019. The last significant sell-off occurred between September 23rd and September 24th. The current Tenken-Sen and Kijun-Sen are nearly equal with Litecoin’s price indicating a near term area of equilibrium and consolidation – this consolidation is confirmed with the Chikou Span current inside the daily candlesticks.
Some key Gann cycles should also be observed. The 2018 Bear Market low on December 14th, 2018, is the start date for many Gann’s Cycles of the Inner Year. The 2019 swing high back on June 22nd was the 180-day Cycle of the inner year, which is the second most potent cycle. Litecoin traded the way we would expect any instrument to trade when it comes against a 180-day cycle: it reversed. That brings us to our current date range and a collection of essential cycles.
Today (October 21st, 2019) is 311-days from December 14th, 2018, representing the 315-day cycle. Today is also 121 days from the June 22nd high, representing the 120-day cycle. Gann wrote that the 120-day cycle usually occurs with the trend and should be watched as countertrend low, mainly if a high was found on the 90 or 180-day cycle. We’ve already established that the 180-day cycle was a major swing high. The 315-day cycle is one of the final cycles that Gann warned could start a fast ‘blow-off’ move. These blow-off moves often end a yearly cycle. Some key calendar days generate cyclic vibrations: 123rd day and the 312th day. The current trend and price range are most definitely with these important Gann dates and cycles. These Gann cycles act as a source of resistance in time to the trend in force. Given the collection of vibrational dates and the probabilities of a trend continuation related to the 120-day and 315-day cycles, we should anticipate a significant move this week.
The difficulty of the analysis here resides with the conflicting conditions of the robust bearish continuation setup with the Ichimoku chart against the bullish reversal probabilities using Gann Analysis. We are near the very end of October, and any cyclical study of cryptocurrencies requires an in-depth analysis of October and the historical price action that cryptocurrencies exhibit around October. Tomorrow’s report will show in detail how prices have historically reacted – but suffice to say, for Litecoin, either direction that Litecoin moves will no doubt be one of the most significant moves since the beginning of the 2018 cryptocurrency bear market.