
Ligand Pharmaceuticals Incorporated (NASDAQ:LGND) reported fourth-quarter 2017 adjusted earnings of $1.31 per share, significantly up 77% from the year-ago figure of 74 cents. The bottom line also beat the Zacks Consensus Estimate of $1.06.
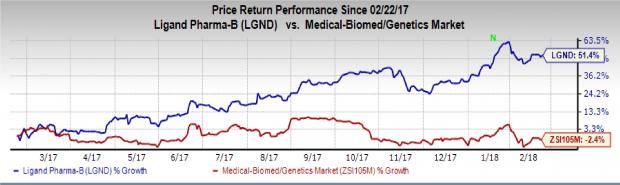
Shares of the company have outperformed the industry in a year’s time. The stock has soared 51.4% versus the industry’s 2.4% decrease.
Total revenues in the quarter surged 32.2% year over year to $50.5 million, mainly on the back of higher royalty revenues. The top line also surpassed the Zacks Consensus Estimate of $47 million.
Quarterly Highlights
Royalty revenues were $28.3 million in the reported quarter, up approximately 45% year over year. Higher royalties on sales of Novartis' (NYSE:NVS) Promacta, Amgen's (NASDAQ:AMGN) Kyprolis and Spectrum Pharmaceuticals' (NASDAQ:SPPI) Evomela drove this upside. Notably, Ligand licenses its platform technologies such as Captisol or OmniAb to these partners for use in their proprietary programs.
Material sales dropped by 15.4% to $7.7 million due to an unfavorable timing of Captisol purchases for clinical and commercial use.
License and milestone revenues were $14.4 million, registering a massive surge of 51.6% compared with $9.5 million in the year-ago period. This upside was attributable to a favorable timing of milestones and license fees earned.
Research & development (R&D) expenses rose 34.4% to $8.6 million. Moreover, general & administrative expenses increased 13.2% year over year to $7.7 million.
2017 Results
Full-year sales improved 29.4% year over year to $141.1 million. The figure surpassed the Zacks Consensus Estimate of $137.7 million. Moreover, the top line surpassed the previous guidance of $134-$136 million.
Full-year earnings of $3.26 per share compared favorably with the Zacks Consensus Estimate of a gain of $3.04. The company had posted earnings of $2.15 a year ago. The bottom line also surpassed the previous projection of $2.95-$3.
Pipeline and Other Updates
Last month, the company entered into two worldwide OmniAb platform license agreements, one with Ferring Pharmaceuticals and the other, with Glenmark Pharmaceuticals. Pursuant to the deals, both companies will use Ligand’s full OmniAb platform to discover fully human mono and multispecific antibodies. Ligand is entitled to receive annual platform access payments, development and regulatory milestone payments and tiered royalties for each product incorporating an OmniAb antibody.
Meanwhile, in October 2017, Ligand signed a contract to acquire Crystal Bioscience. Per this buyout, Crystal Bioscience’s HuMab technology will be part of Ligand’s OmniAb brand and be called OmniChicken. Addition of this OmniChicken platform to Ligand’s OmniAb technology supplements a third species for the fully-humanized antibody discovery.
With respect to the company’s internal pipeline, various candidates are under development for indications like diabetes. One of the most advanced candidates is LGD-6972, presently undergoing a phase II trial for treatment of type II diabetes. The company reported positive top-line data from the same in only last September.
2018 Outlook
Ligand expects its 2018 revenues to be approximately $164 million, higher than revenues of $141.1 million in 2017. This year, the company anticipates an additional $20 million of license fees and milestone payments.
Adjusted earnings are estimated at $4.22 per share for 2018, much ahead of 2017 earnings of $3.26.
Ligand Pharmaceuticals Incorporated Price, Consensus and EPS Surprise
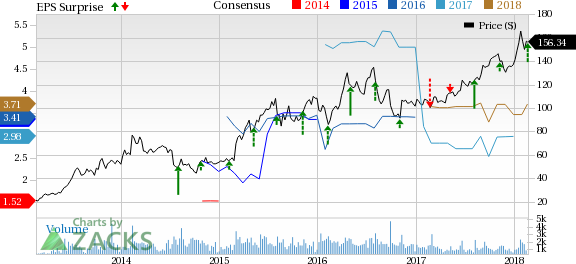
Ligand Pharmaceuticals Incorporated Price, Consensus and EPS Surprise | Ligand Pharmaceuticals Incorporated Quote
Zacks Rank
Ligand carries a Zacks Rank #3 (Hold). You can see the complete list of today’s Zacks #1 Rank (Strong Buy) stocks here.
More Stock News: This Is Bigger than the iPhone!
It could become the mother of all technological revolutions. Apple (NASDAQ:AAPL) sold a mere 1 billion iPhones in 10 years but a new breakthrough is expected to generate more than 27 billion devices in just 3 years, creating a $1.7 trillion market.
Zacks has just released a Special Report that spotlights this fast-emerging phenomenon and 6 tickers for taking advantage of it. If you don't buy now, you may kick yourself in 2020.
Click here for the 6 trades >>
Novartis AG (NVS): Free Stock Analysis Report
Amgen Inc. (AMGN): Free Stock Analysis Report
Ligand Pharmaceuticals Incorporated (LGND): Free Stock Analysis Report
Spectrum Pharmaceuticals, Inc. (SPPI): Free Stock Analysis Report
Original post