Life Technologies Corporation (LIFE) is a global life sciences company. It delivers a range of products and services, including systems, instruments, reagents, software, and custom services.
I found this stock using a real-time custom scan. This one hunts for elevated vols:
Custom Scan Details
Stock Price GTE $5
IV30™ GTE 30
IV30™ Percentile GTE 80
Average Option Volume GTE 1,200
The goal with this scan is to identify short-term implied vol (IV30™) that is elevated to its own annual history (at least in the 80th percentile). I'm also looking for a reasonable amount of liquidity in the options (thus the minimum average option volume), and I want a minimum vol level so I don't pick up any boring ETF’s (or whatever). The stock price requirement helps me identify names that have enough strike prices to trade or spread.
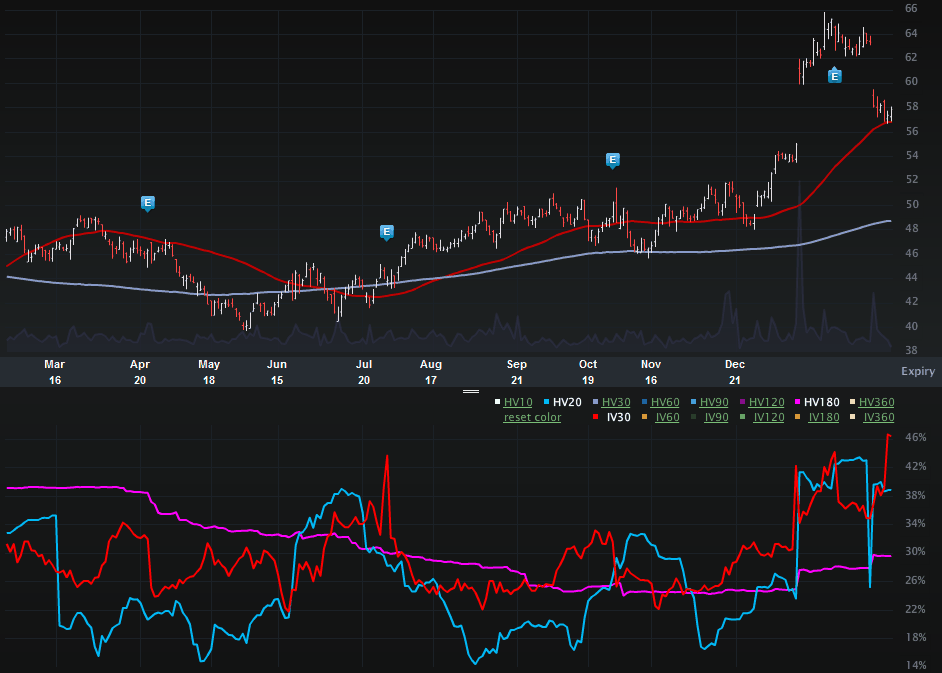
The one-year LIFE Charts Tab is included (below). The top portion is the stock price the bottom is the vol (IV30™ - red vs HV20™ - blue vs HV180™ - pink).
On the stock side we can see a nice Y-O-Y return from $47.89 to now about $10 higher, or more than 20% in a year. But, most notably, check out the price action of late.
There was a gap up on 1-18-2013 from $54.97 to $60.79 when the firm released news that it was exploring a buyer – i.e. buyout speculation . The stock continued to rise off that spec move all the way to $65.84 (its annual high), and then… there was earnings. And quiet… And then there was 2-20-2013 (seven days ago) when the stock gapped down from$63.36 to $58.13 when rumors circulated that the buy-out interest had gone cold.
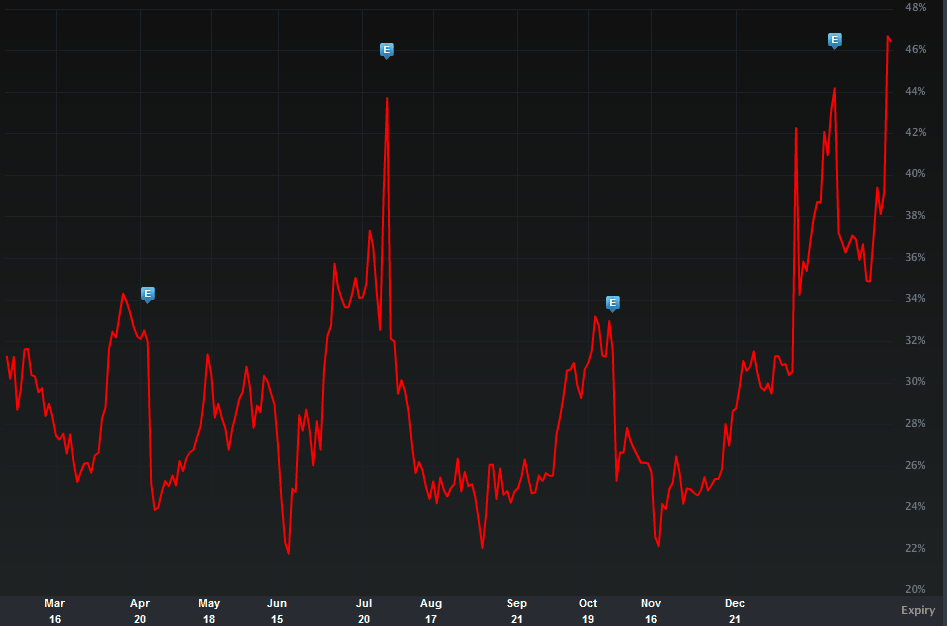
Let’s turn to the IV30™ one-year chart in isolation, below.
We can see that the implied spiked on the gap up in mid-Jan on the takeover rumors, then collapsed, then spiked again into earnings, then collapsed and now has spiked again off of the drop on 2-20-2013 (on news perhaps of no takeover) and continued to rise. From the scan results we can see the implied is trading at its annual high, and I would say for good reason given the recent stock moves. Keep in mind, that all of the stock moves have surrounded exogenous factors – not organic internal factors. Given the whip-saw action, I think vol should be at an annual high… and maybe even higher than the current level.
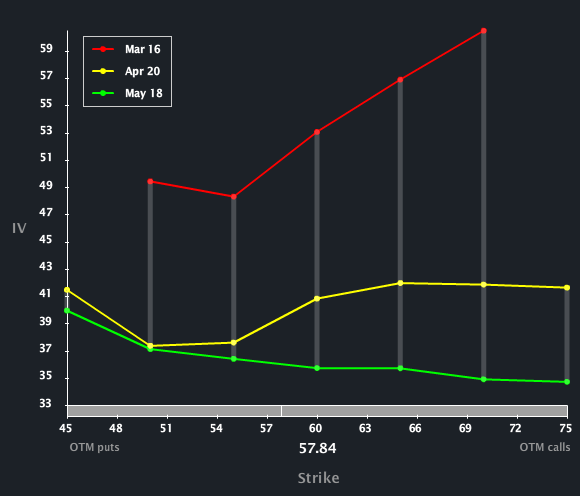
Let’s turn to the Skew Tab to examine the line-by-line and month-to-month vols.
We can see a monotonic increase in vol from the back to the front. But, more notably, the vol diff between Mar and the back months is quite substantial. The option market reflects greater risk in the near-term than the intermediate – and for good reason.
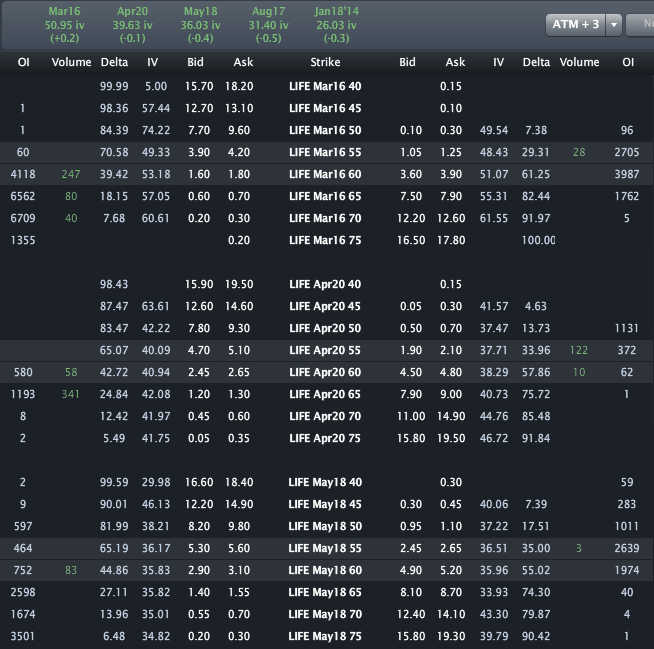
Finally, let's look to the Options Tab (below).
Across the top we can see the monthly vols are priced to 50.95%, 39.63% and 36.03% for Mar, Apr and May. Again, note that vol diff between Mar ad the back expiries. This will almost certainly be one where either the vol is far too elevated or not even close to elevated enough. I guess we’ll see…
Disclosure: This is trade analysis, not a recommendation.
Images provided by Livevol®
- English (UK)
- English (India)
- English (Canada)
- English (Australia)
- English (South Africa)
- English (Philippines)
- English (Nigeria)
- Deutsch
- Español (España)
- Español (México)
- Français
- Italiano
- Nederlands
- Português (Portugal)
- Polski
- Português (Brasil)
- Русский
- Türkçe
- العربية
- Ελληνικά
- Svenska
- Suomi
- עברית
- 日本語
- 한국어
- 简体中文
- 繁體中文
- Bahasa Indonesia
- Bahasa Melayu
- ไทย
- Tiếng Việt
- हिंदी
LIFE: Vol Breaches Annual High As Stock Gaps Off Of Takeover Rumors
Published 02/28/2013, 05:12 AM
Updated 07/09/2023, 06:31 AM
LIFE: Vol Breaches Annual High As Stock Gaps Off Of Takeover Rumors
3rd party Ad. Not an offer or recommendation by Investing.com. See disclosure here or
remove ads
.
Latest comments
Install Our App
Risk Disclosure: Trading in financial instruments and/or cryptocurrencies involves high risks including the risk of losing some, or all, of your investment amount, and may not be suitable for all investors. Prices of cryptocurrencies are extremely volatile and may be affected by external factors such as financial, regulatory or political events. Trading on margin increases the financial risks.
Before deciding to trade in financial instrument or cryptocurrencies you should be fully informed of the risks and costs associated with trading the financial markets, carefully consider your investment objectives, level of experience, and risk appetite, and seek professional advice where needed.
Fusion Media would like to remind you that the data contained in this website is not necessarily real-time nor accurate. The data and prices on the website are not necessarily provided by any market or exchange, but may be provided by market makers, and so prices may not be accurate and may differ from the actual price at any given market, meaning prices are indicative and not appropriate for trading purposes. Fusion Media and any provider of the data contained in this website will not accept liability for any loss or damage as a result of your trading, or your reliance on the information contained within this website.
It is prohibited to use, store, reproduce, display, modify, transmit or distribute the data contained in this website without the explicit prior written permission of Fusion Media and/or the data provider. All intellectual property rights are reserved by the providers and/or the exchange providing the data contained in this website.
Fusion Media may be compensated by the advertisers that appear on the website, based on your interaction with the advertisements or advertisers.
© 2007-2024 - Fusion Media Limited. All Rights Reserved.
