
Lennar Corporation (NYSE:LEN) has been benefitting from prudent land investment strategies, strengthening housing market, dynamic pricing model and operating efficiency over the last few quarters.
However, higher construction and land costs, along with increased incentives are pressurizing its margins. Notably, lower backlog due to pull-through of deliveries raises a concern. Meanwhile, shares of the company have rallied 10.8% in the past six months, comparing unfavorably with its industry’s 19.4% growth.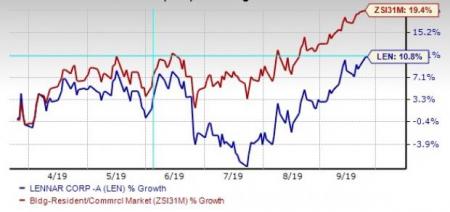
Let’s delve into the factors substantiating its Zacks Rank #3 (Hold). You can see the complete list of today’s Zacks #1 Rank (Strong Buy) stocks here.
Catalysts Driving Growth
Land Investment Strategy: Lennar prudently invests in low-cost new home sites in well-positioned markets during recession, which enables it to meet the growing demand during the upturn. This provides the company with a competitive edge over its peers that are facing land-availability constraints.
While Lennar’s Homebuilding division is the primary driver of near-term profitability, the Multi-Family business provides diversification and complementary long-term growth opportunities.
Dynamic Pricing Model: Courtesy of the dynamic pricing strategy, Lennar has taken advantage of the strong spring selling season, which is helping it to maximize cash flow and return on inventory. This is evident from its recent backlog data. Lennar ended fiscal second-quarter 2019 with a sales backlog of 19,061 homes, having a dollar value of $7.7 billion.
Based on its existing land position, operating strategy and dynamic pricing model, the company expects to deliver between 50,000 and 51,000 homes in 2019, with increased efficiency, improving margins, strong bottom-line growth and cash flow.
Operational Efficiencies: Amid affordability challenges and general housing market uncertainty, Lennar delivered impressive results in both fiscal first and second quarters. Notably, in the fiscal second quarter, the company reported Homebuilding operating margin of 11.6%, up 320 basis points (bps) from the prior-year period.
As a matter of fact, its core homebuilding earnings are growing at a faster rate than revenues. This indicates increased operating efficiency. Improved operating leverage, as a result of an increase in home deliveries and benefits from technology initiatives, enabled Lennar to reduce SG&A expenses in the past three years. In the first half of fiscal 2019, SG&A expenses — as a percentage of revenues from home sales — improved 10 bps, courtesy of improved operating leverage.
Major Headwinds
Industry Headwinds: The U.S. homebuilding industry faces headwinds in the form of ongoing labor crisis, higher material cost pressures that arise from tariffs, and the availability of affordable homes. In fact, this is a common hurdle for many homebuilding companies like PulteGroup, Inc. (NYSE:PHM) , KB Home (NYSE:KBH) and D.R. Horton, Inc. (NYSE:DHI) , among others.
Worryingly enough, Lennar is currently facing a shortage of skilled labor. As a result, the cost of labor has increased in recent times. Labor cost, which represents 43% of its direct costs, was up 2.8% sequentially in the fiscal second quarter and 7.7% year over year.
Higher Incentives Dent Margins: During the fiscal second quarter, the company reported gross margin at the lower end of its guided range, owing to greater-than-expected incentives used during the market slowdown to maintain volume. Nonetheless, it expects margins to improve sequentially.
Today's Best Stocks from Zacks
Would you like to see the updated picks from our best market-beating strategies? From 2017 through 2018, while the S&P 500 gained +15.8%, five of our screens returned +38.0%, +61.3%, +61.6%, +68.1%, and +98.3%.
This outperformance has not just been a recent phenomenon. From 2000 – 2018, while the S&P averaged +4.8% per year, our top strategies averaged up to +56.2% per year.
See their latest picks free >>
PulteGroup, Inc. (PHM): Free Stock Analysis Report
D.R. Horton, Inc. (DHI): Free Stock Analysis Report
Lennar Corporation (LEN): Free Stock Analysis Report
KB Home (KBH): Free Stock Analysis Report
Original post
- English (UK)
- English (India)
- English (Canada)
- English (Australia)
- English (South Africa)
- English (Philippines)
- English (Nigeria)
- Deutsch
- Español (España)
- Español (México)
- Français
- Italiano
- Nederlands
- Português (Portugal)
- Polski
- Português (Brasil)
- Русский
- Türkçe
- العربية
- Ελληνικά
- Svenska
- Suomi
- עברית
- 日本語
- 한국어
- 简体中文
- 繁體中文
- Bahasa Indonesia
- Bahasa Melayu
- ไทย
- Tiếng Việt
- हिंदी
Lennar (LEN) Core Homebuilding Business Solid Amid High Cost
Published 09/23/2019, 10:22 PM
Updated 07/09/2023, 06:31 AM
Lennar (LEN) Core Homebuilding Business Solid Amid High Cost
Latest comments
Loading next article…
Install Our App
Risk Disclosure: Trading in financial instruments and/or cryptocurrencies involves high risks including the risk of losing some, or all, of your investment amount, and may not be suitable for all investors. Prices of cryptocurrencies are extremely volatile and may be affected by external factors such as financial, regulatory or political events. Trading on margin increases the financial risks.
Before deciding to trade in financial instrument or cryptocurrencies you should be fully informed of the risks and costs associated with trading the financial markets, carefully consider your investment objectives, level of experience, and risk appetite, and seek professional advice where needed.
Fusion Media would like to remind you that the data contained in this website is not necessarily real-time nor accurate. The data and prices on the website are not necessarily provided by any market or exchange, but may be provided by market makers, and so prices may not be accurate and may differ from the actual price at any given market, meaning prices are indicative and not appropriate for trading purposes. Fusion Media and any provider of the data contained in this website will not accept liability for any loss or damage as a result of your trading, or your reliance on the information contained within this website.
It is prohibited to use, store, reproduce, display, modify, transmit or distribute the data contained in this website without the explicit prior written permission of Fusion Media and/or the data provider. All intellectual property rights are reserved by the providers and/or the exchange providing the data contained in this website.
Fusion Media may be compensated by the advertisers that appear on the website, based on your interaction with the advertisements or advertisers.
© 2007-2024 - Fusion Media Limited. All Rights Reserved.