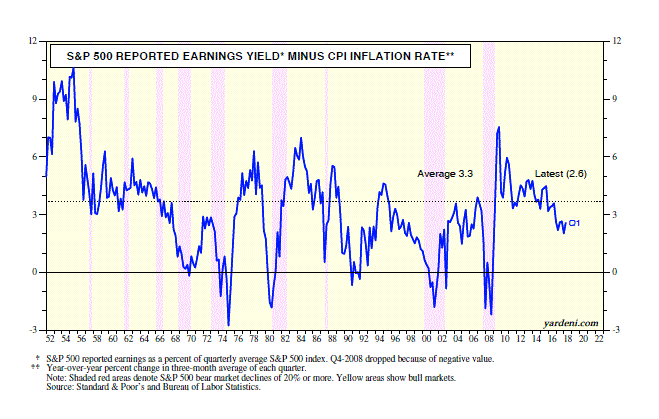
The May 7 issue of Barron’s included an interview with my good friend John Apruzzese, the chief investment officer of Evercore Wealth Management. In my new book, Predicting the Markets, Chapter 14 is titled “Predicting Valuation.” I explore various models for assessing whether the stock market is undervalued, fairly valued or overvalued. I discuss a model that John and I both favor as follows:
The earnings yield of the S&P 500, which is simply the reciprocal of the P/E based on reported earnings, is highly correlated with the CPI inflation rate on a year-over-year basis. The real earnings yield (REY) of the S&P 500 is the difference between the nominal yield and the inflation rate. The result is a mean-reversion valuation model that logically includes inflation. The average of the real yield since 1952 is 3.3%. The model tends to anticipate bear markets when the yield falls close to zero. John Apruzzese ... examined this model in a November 2017 paper titled "A Reality Check for Stock Valuations." Based on the REY model, he found that "stocks appear more reasonably priced than the conventional P/E ratio suggests during periods of low inflation and rising markets, and more expensive during periods of high inflation and falling markets when they otherwise might seem cheap."

As I noted, there are lots of valuation models. None is infallible. None is right all the time. I like the REY model because it reflects the impact of inflation on valuation. As John observes:
Inflation is absolutely crucial for long-term investors. It’s the most important macro factor. Oddly, the market is stuck on the P/E ratio.
I agree and devote a chapter to “Predicting Inflation.”
Around, Above And Below
The average value of the REY since 1952 has been 3.3%. Presumably, the market is fairly valued around this level, undervalued above it and overvalued below it. The REY was 2.6% during the first quarter of this year. Since the late 1960s, it worked relatively well as a bear market leading indicator when it fell closer to zero. It also turned out to be a relatively good bull-market indicator when it rose back above zero and exceeded its historical average.
In his paper, John concludes:
As of September 30, REY is 3.0%, near its 60-year average, based on a nominal earnings yield of 4.7% and a 1.7% core inflation rate. That indicates that the stock market is fairly valued. By no means does it look like one of the most overvalued markets in history, as measures such as the trailing P/E ratio and the Shiller P/E ratio suggest.
I agree.
