Retail department store operator Kohls Corp (NYSE:KSS) has been consolidating in an ever-tightening range for the past five months and underperforming the benchmark S&P 500 index. While the restart acceleration may be stifling with the surge in COVID-19 cases, the share look ready to breakout. Shares were hurt in the prior earnings release due to the resurgence of COVID-19 affecting some locations. The third surge of the pandemic and the race for an FDA approved vaccine are approaching the apex. With the holiday shopping season approaching, the lack of volatility has set the bar low as Kohl’s could be a sleeper stock to watch for an inevitable range break. Prudent investors can look for opportunistic pullback levels to gain exposure.
Q2 FY 2020 Earnings Release
On Aug. 21, 2020, Kohl’s released its fiscal second-quarter 2021 results for the quarter ending July 2020. The Company reported an adjusted earnings-per-share (EPS) loss of (-$0.25) excluding non-recurring items versus consensus analyst estimates for a loss of (-$0.88), beating estimates by $0.63. Revenues fell by (-23.1%) year-over-year (YOY) to $3.41 billion beating analyst estimates for $3.07 billion.
Conference Call Takeaways
Kohl’s CEO, Michelle Gass, stated that Company, “achieved positive adjusted EBITDA, generated positive free cash flow and increased our cash position to over $2.4 billion.” The quarter results were impacted by (-25%) fewer operating days for reopened stores along with limited hours. May was the worst month for the quarter at the peak of the pandemic. Sales improved strong with most stores reopen with limited hours in June but decelerated in July from soft back-to-school sales and escalated COVID-19 concerns in hotspots. Reopened stores hit 75% productivity and digital sales grew 58% YoY. Omnichannel was key in the quarter as stores fulfilled 50% of digital sales. In store pick-ups of digital orders accounted for 15% of digital sales with half done using the Store Drive-Up curbside pickup service. Digital sales represented 41% of total sales, up 20% YoY.
Holiday Season
CEO Gass pointed out, “We expect many customers to get ahead of their holiday shopping, and increasingly leverage our digital and omni channel capabilities… to capture anticipated early holiday demand beginning in October across all of our channels.” She noted how COVID has influenced consumer preferences to more active and casual lifestyles with accelerated digital shopping. These all play into the core of Kohl’s as a “casual destination”. The Company is capitalizing on consumer trends in active and athleisure dedicating more space in stores to accommodate. With 80% of customers living within 15 miles of a Kohl’s store, the Store Drive-Up service is expected to be see heavy traffic. The Amazon Return (NASDAQ: NASDAQ:AMZN) service enables the easy convenience of returning Amazon orders to local Kohl’s stores for immediate refunds. The Company is launching a more integrated Loyalty rewards program, which has 30 million members.
The December Brick and Mortar Advantage
One of the advantages of brick and mortar locations during holiday shopping season is the potential slowdown of shipping and out of stock problems with online orders. This inevitably trigger the panic mad dash to the physical retail stores to ensure that Christmas presents are under the tree before, not after, Christmas. About two-weeks out from the holidays, retailers tend to see a surge of last minute shoppers that can’t receive deliveries on time. This plays right into Kohl’s omnichannel strategy and Store Drive-Up service. The bar is set low heading into the holiday shopping season and Q3 2020 results. Keep in mind that the last quarter was affected by brick and mortar stores operating on (-25%) fewer days in the quarter. The early holiday buying season warrants watching for opportunistic pullback levels sooner rather than later.
insert KSSchart1-labelled graphic
KSS Opportunistic Pullback Levels
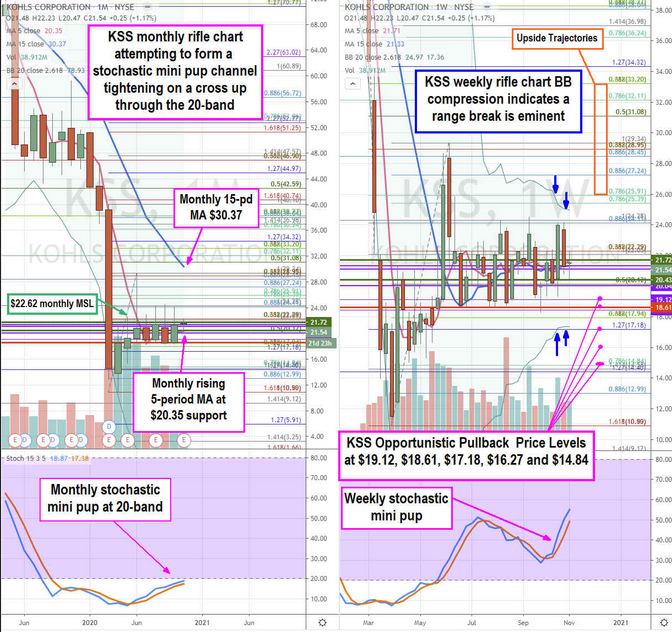
Using the rifle charts on the monthly and weekly time frames provides a broader view of the landscape for KSS stock. The monthly rifle chart appears to have stabilized with a rising 5-period moving average (MA) support at $20.35. The monthly stochastic is attempting a mini pup as it nears the 20-band oversold coil level and monthly market structure low (MSL) buy trigger at $22.63. The weekly rifle chart illustrates the multi-month price range between the $24.29 and $18.61 Fibonacci (fib) level as the Bollinger Bands (BB) compression indicates an inevitable range expansion. The weekly stochastic has a mini pup but moving averages are flat with upside potential to the upper BBs at $24.97. The bearish case would be a breakdown under the monthly 5-period MA to trigger a monthly inverse pup. Prudent investors can watch for opportunistic pullback levels at the $19.12 fib, $18.61 fib, $17.18 fib, $16.27 fib and the $14.84 fib. Nimble traders may opt to take the monthly MSL buy trigger with tight stops in the event a weekly range breakout forms. Long-term investors may consider waiting for the Q3 2020 earnings results before taking exposure.

