After the Reserve Bank of New Zealand left the official cash rate unchanged at 3.5% as expected. The dip came after RBNZ Governor Graeme Wheeler repeated that the exchange rate has yet to adjust materially to the lower commodity prices. Its current level remains unjustified and unsustainable and further depreciation is expected particularly when the US Fed starts raising rates. In order to assess the impact of the recent rate hikes and the reductions in export prices, the Bank softened its stance on future interest rate increases for a period of “monitoring and assessment”.
Chinese CPI rose at a slower pace of 2.0% yoy in August from 2.3% yoy in July, missing forecast of 2.2% yoy. The nation’s inflation eased to a four-month low, adding to signs of weakness in domestic demand shown from the drop in imports earlier this week. The PPI rate fell at an accelerating pace of -1.2% yoy from -0.9% yoy, worse than market consensus. This amplifies the case for additional measures to support the Chinese economy.
The Australian dollar strengthened after the country’s unemployment rate declined from its 12-year high. The bigger-than-expected decline to 6.1% in August from 6.4% previously, pushed AUD up against the greenback.
The British pound gained against the greenback after the hearing of Bank of England Governor Carney and other MPC members on the August inflation report to the Treasury Select Committee. GBP strengthened as Governor Carney said that as the UK economy continues to normalize, the Bank will need to start to raise interest rates to achieve its inflation target. On the uncertainty surrounding the Scottish referendum, the Governor said that the Bank has contingency plans for the Scottish independence and they will certainly implement them if required. Despite the assurance of existing plans, we believe that the negative sentiment towards the pound has been entrenched and only after the referendum we could see a change in investors’ view.
The Swiss franc plummeted on Wednesday after an alternate member of the Swiss National Bank Governing Board said that negative interest rates remain as an option for the Bank. His remarks were consistent with SNB President Thomas Jordan who repeatedly argued that the central bank won’t exclude any measures to secure adequate monetary conditions in Switzerland. CHF has recently moved toward the 1.2000 floor against the Euro as the bloc’s single currency weakened in last weeks. The plunge in Swiss franc may be attributed to the fact that investors “realized” that the Bank may use other methods than its official reserves to support the floor and this could be announced at SNB September 18 meeting.
Today, we get the German final CPI for August. As usual, the final forecast is the same as the initial estimate. French CPI for the same month is also coming out.
From Sweden, we get the PES unemployment rate, the official unemployment rate and the country’s CPI, all for August. Both unemployment rates are expected to rise, while the CPI is forecast to drop 0.1% yoy, from 0.0% yoy. The weak data coming from the country ahead of the general election this Sunday, could add to the growing body of evidence that Sweden’s recovery is losing momentum.
In the US, we get the initial jobless claims for the week ended September 6.
From Canada, the new housing price index for July are forecast to have accelerated.
We have one speaker on Thursday’s agenda. ECB President Mario Draghi delivers the keynote speech at the Eurofi financial forum in Milan.
The Market
EUR/USD in a consolidative mode
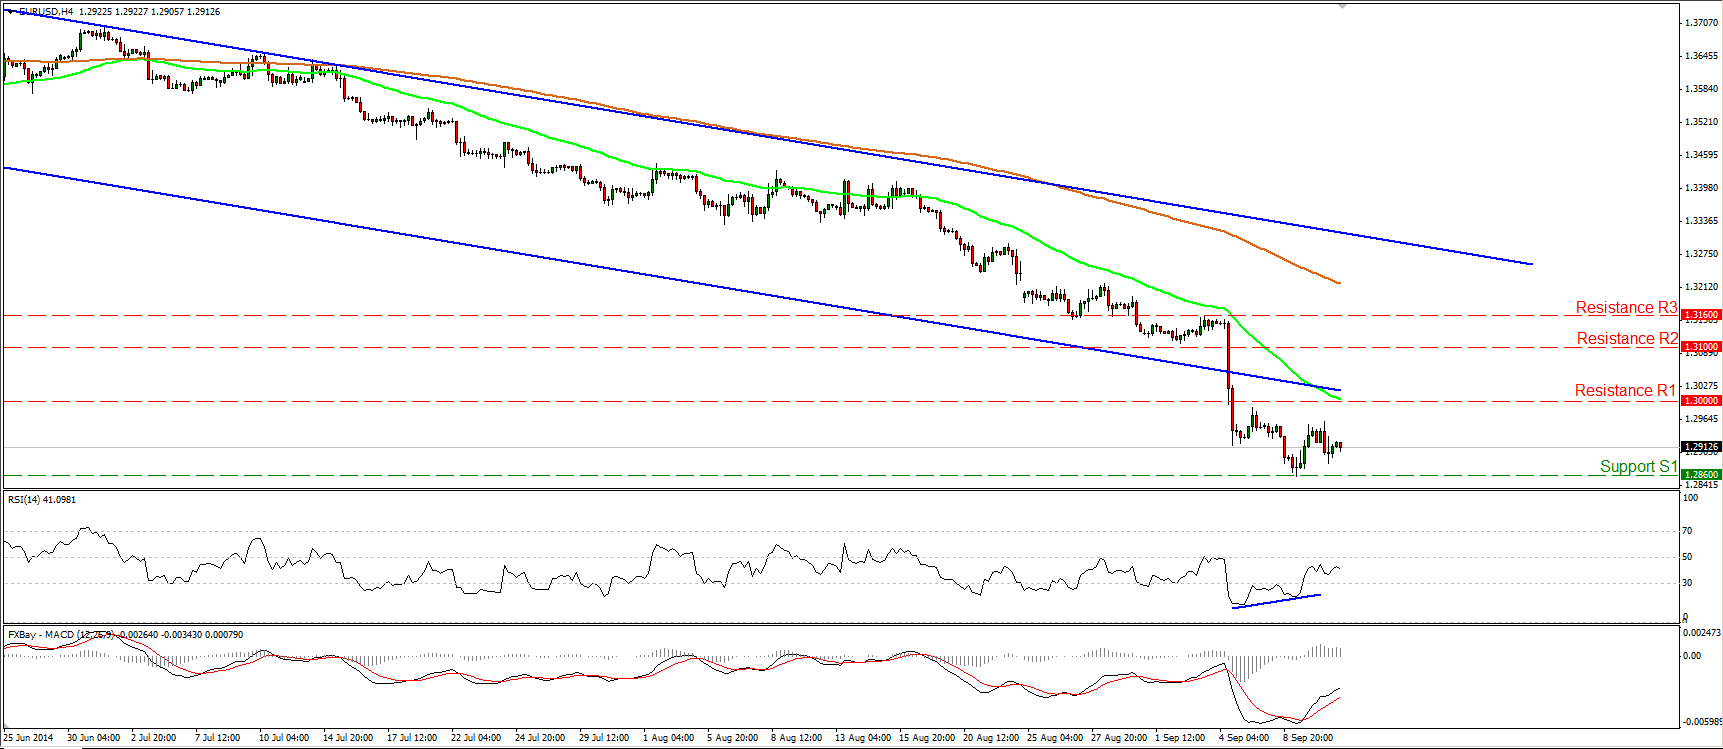
EUR/USD moved in a consolidative mode on Wednesday, remaining between the support line of 1.2860 (S1) and the psychological barrier of 1.3000 (R1). The MACD moved higher after crossing above its signal line, while the positive divergence between the RSI and the price action is still in effect. Having these signs in mind, I would remain cautious of further upside in the near future, maybe to test the psychological line of 1.3000 (R1) as a resistance this time. Nevertheless, on the daily chart, the price structure remains lower highs and lower lows below both the 50- and the 200-day moving averages, thus I still see a negative overall picture. A clear move below 1.2860 (S1), is likely to trigger extensions towards the key support zone of 1.2760 (S2), defined by the lows of March and July 2013.
• Support: 1.2860 (S1), 1.2760 (S2), 1.2660 (S3).
• Resistance: 1.3000 (R1), 1.3100 (R2), 1.3160 (R3).
GBP/JPY surges towards 173.30
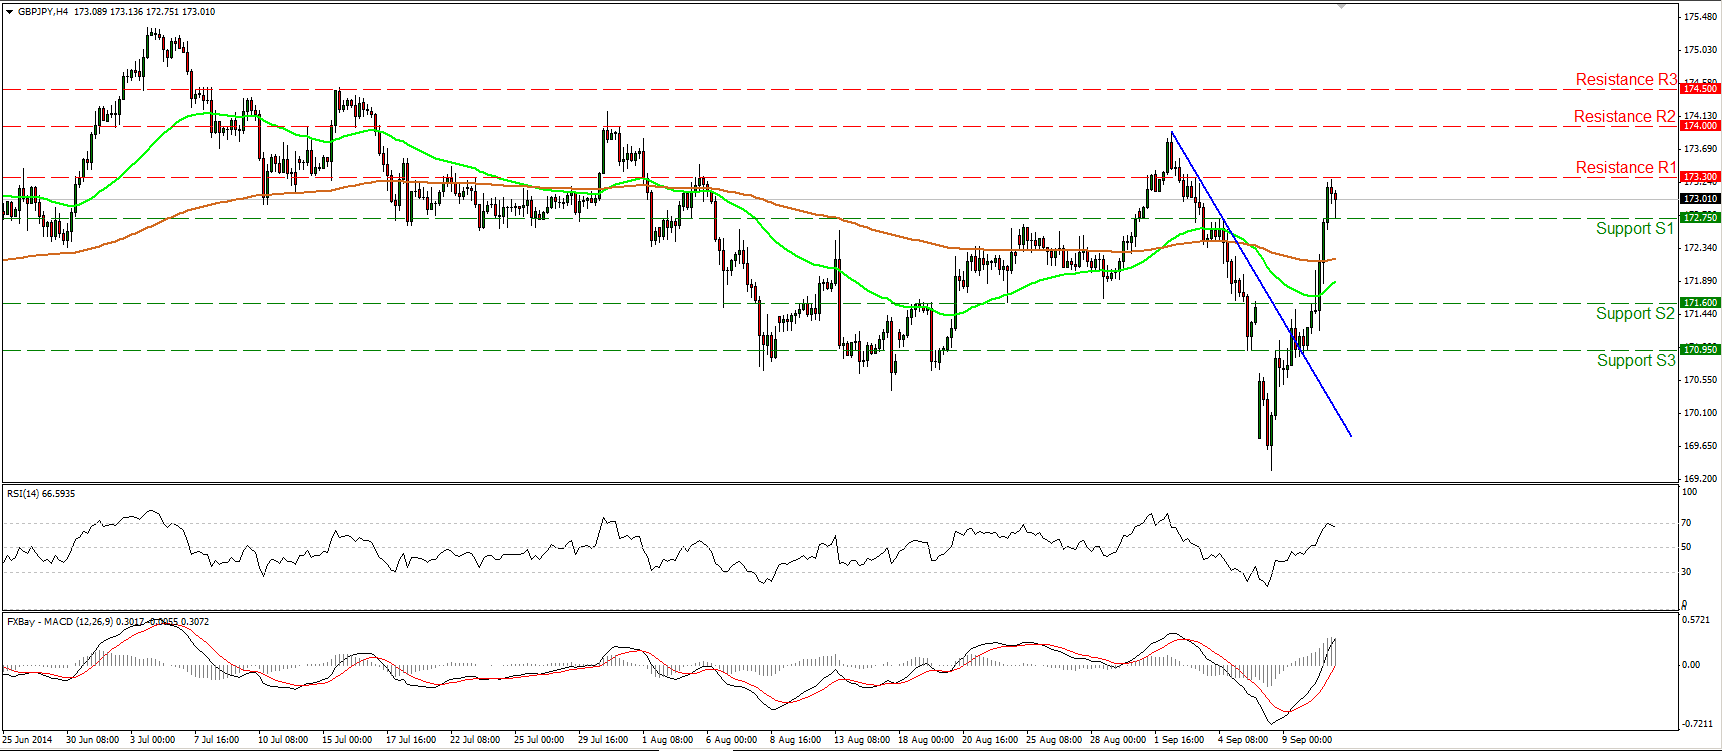
GBP/JPY surged yesterday, violating the blue minor-term trend line and two resistance (turned into support) lines in a row. Although we had a strong rally, I would prefer to remain neutral as the price structure does not suggest trending conditions. The MACD lies above both its signal and zero lines, confirming yesterday’s strong positive momentum, but the RSI found resistance at its 70 line and is now pointing down, favoring a pullback. These mixed momentum signals give me another reason to remain flat, at least for now.
• Support: 172.75 (S1), 171.60 (S2), 170.95 (S3).
• Resistance: 173.30 (R1), 174.00 (R2), 174.50 (R3).
NZD/USD dips after the RBNZ meeting
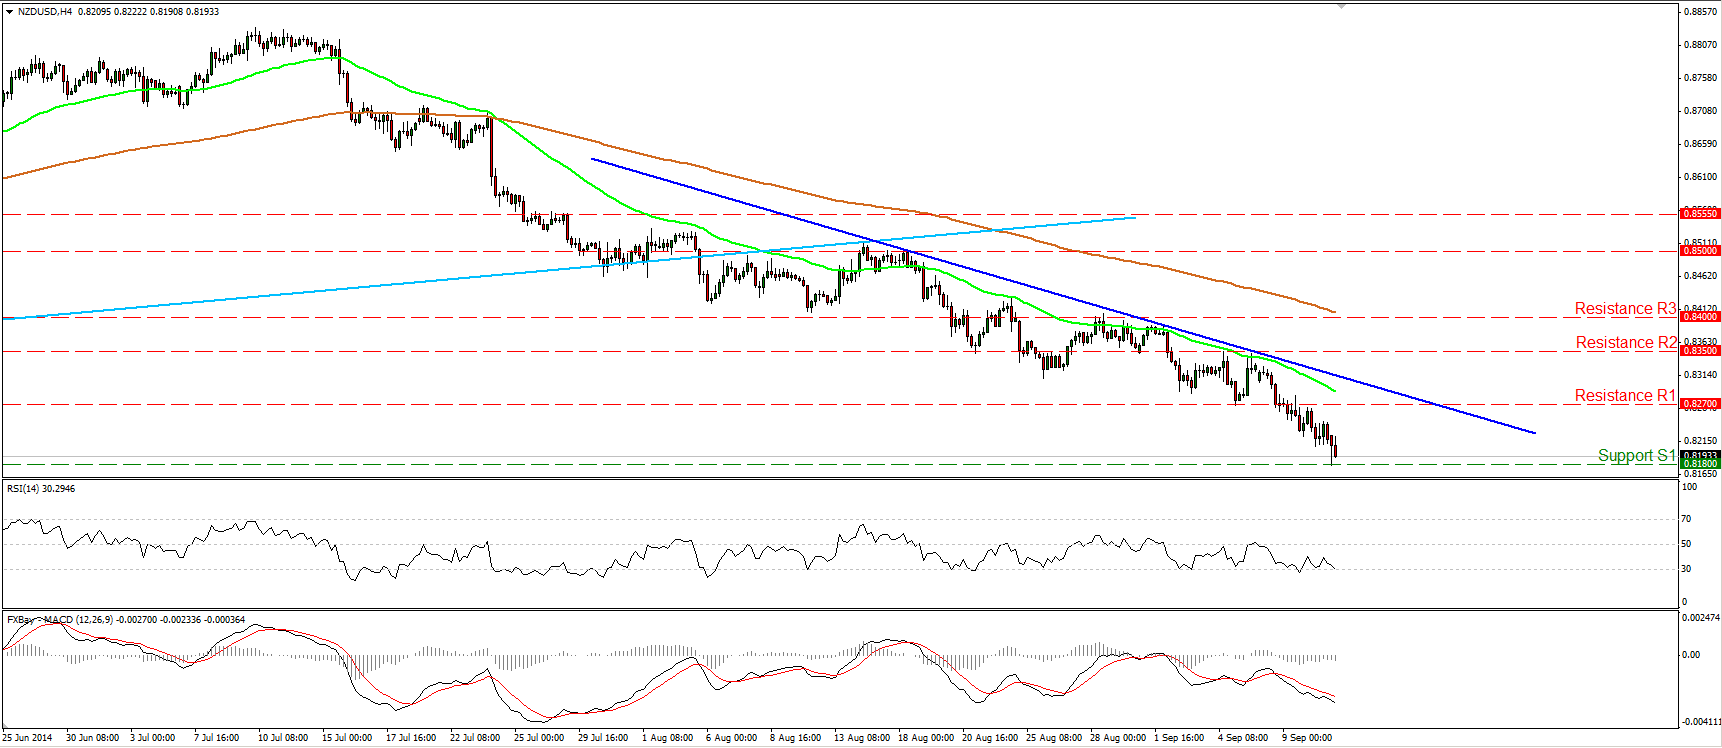
NZD/USD tumbled during the Asian morning, after the RBNZ kept its key rate at 3.5% and said that kiwi’s current level is “unjustified and unsustainable”. NZD/USD reached our support line of 0.8180 (S1), where a decisive dip is likely to set the stage for extensions towards the next support line at 0.8080 (S2), defined by the low of the 29th of November 2013 and lows at the beginnings of February 2014. As long as the pair is trading below the near-term blue downtrend line and below the prior longer-term uptrend line (light blue line), drawn from back at the 30th of August 2013, the overall picture remains negative, in my view.
• Support: 0.8180 (S1), 0.8080 (S2), 0.8000 (S3).
• Resistance: 0.8350 (R1), 0.8400 (R2), 0.8500 (R3).
Gold remains near the lower bound of the channel
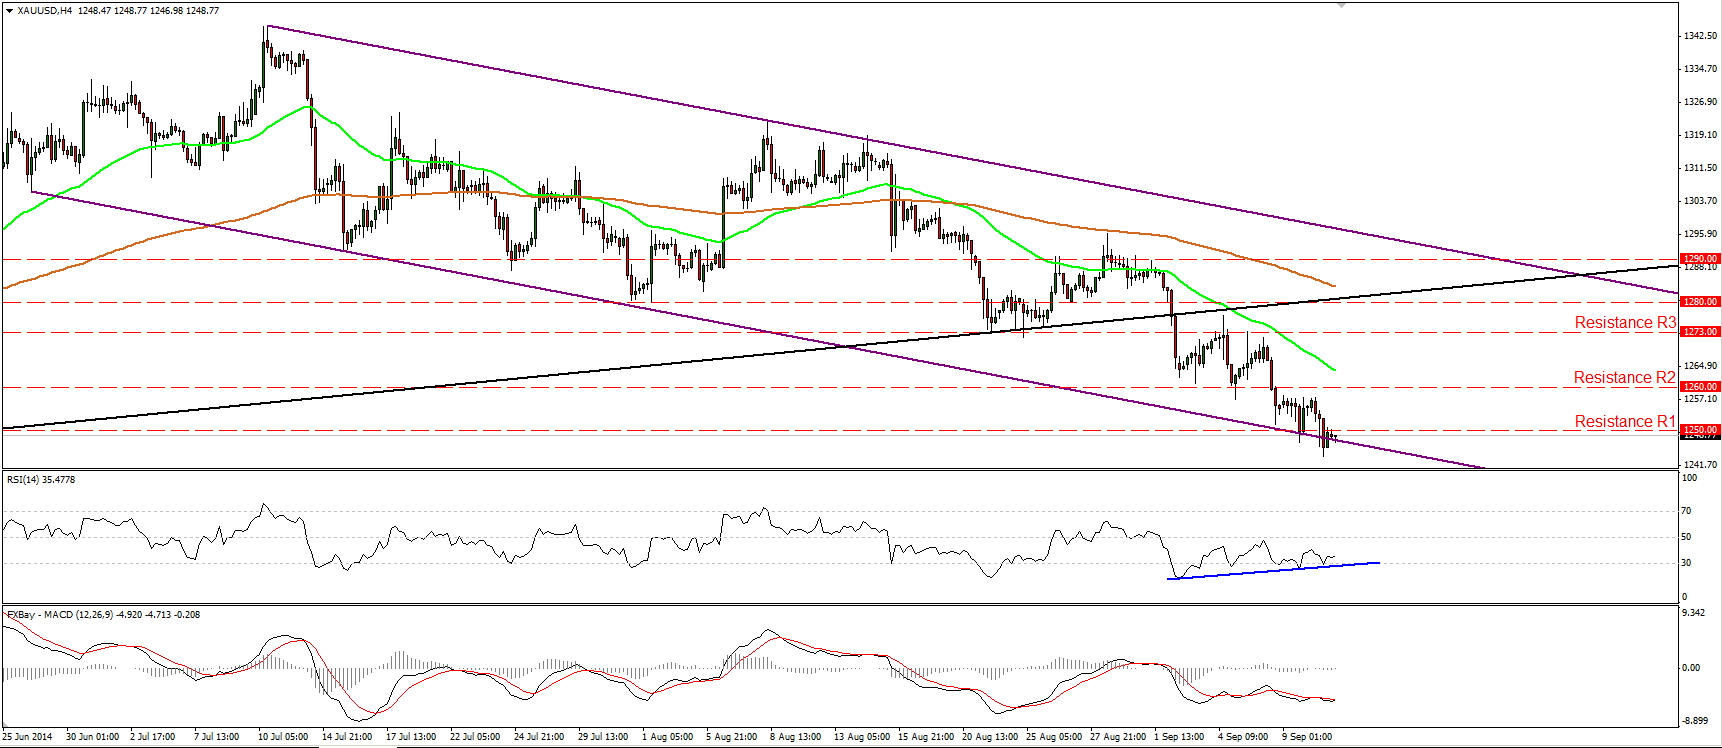
Gold moved lower yesterday, breaking below the 1250 (support turned into resistance) barrier. However, the precious metal remained near the lower boundary of the purple downside channel. Given our proximity to the lower line of the channel and the fact that the positive divergence between the RSI and the price action remains in effect, I would still be cautious of a possible upside corrective move in the near future. Nevertheless, as long as the metal is trading within the aforementioned downside channel and below the black line drawn from back at the low of the 31th of December, I consider the overall path to be to the downside.
• Support: 1240 (S1), 1230 (S2), 1220 (S3).
• Resistance: 1250 (R1), 1260 (R2), 1273 (R3).
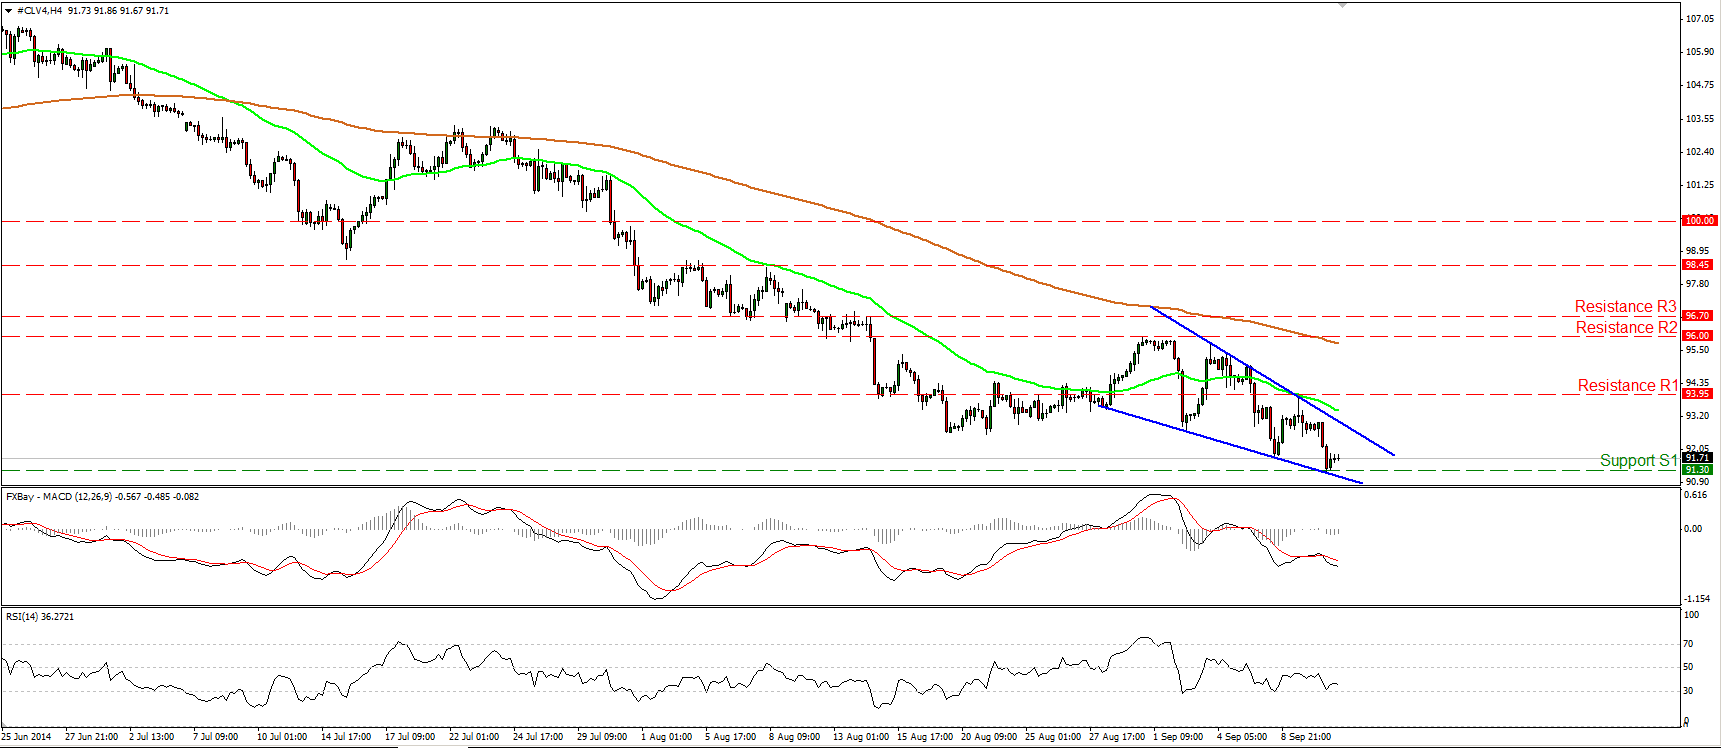
WTI hits the critical support o 91.30
WTI moved lower yesterday to find support at the critical line of 91.30 (S1), a barrier that provided strong support to the price action and has not been violated since May 2013. Having that in mind and the fact that WTI seems to be forming a falling wedge formation, I would prefer to take the sidelines for now. A clear and decisive dip below 91.30 (S1) could carry larger bearish implications and could open the way for 85.75 (S3), defined by the lows of the 18th of April 2013. On the other hand, a clear move above 93.95 (R1) is likely confirm the upside escape from the wedge pattern and could pave the way for the next resistance at 96.00 (R2).
• Support: 91.30 (S1), 90.00 (S2), 85.75 (S3).
• Resistance: 93.95 (R1), 96.00 (R2), 96.70 (R3) .

