This past week saw the release of consumer credit datafor May. At first I was surprised by the significant difference between the adjusted and unadjusted data.
- The adjusted data was suggesting consumer credit growth was accelerating;
- The unadjusted data was consumer credit growth was slightly decelerating for the last 3 months (see figure 2 blue line below).
Note that this data series does not include home mortgages.
Figure 1: Unadjusted Consumer Credit Growth – Year-over-Year Percent Change (blue line)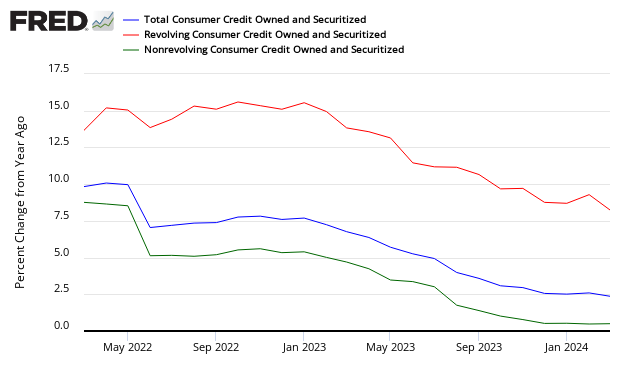
Since the Great Recession, student loans have been distorting credit growth – with student loan growth since the beginning of recession accounting for more 100% of the total consumer credit growth. It was not until 2012 that non-student loan consumer credit finally began growing, and surprisingly at the same time the rate of growth of student loans began to decline. When student loans are backed out of the data, annual consumer credit growth acceleration is obvious (red line chart below).
Figure 2: Year-over-Year Consumer Credit Growth With Student Loans (blue line) and Growth without Student Loans Backed Out (red line)
Some believe student loans are an investment that has a two fold benefit.
- it feeds economic growth today by adding to education expenditures;
- it feeds economic growth tomorrow by allowing higher earning potential
There is a general trend correlation between consumer credit and GDP. The question is whether student loans (whose recent massive influence on consumer credit growth) is a factor in this correlation. If it is a factor, the growth rate of consumer credit (including student loans) is diminishing, and it could follow that the GDP growth trend should also be less good.
Figure 3: Long Term Comparison Consumer Credit (blue line) to GDP (red line)
But in all events, it should be obvious from the above graphic that the rate of consumer credit growth and GDP growth has been trending down since 1990. Part of the difference is use of debit vs credit cards as credit card balance growth is barely keeping up with population growth. Correlation of general trends does not establish causation, nor does it positively determine a relationship except in passing. Logically, well placed borrowing should stimulate the economy by providing leverage for investment.
Many believe one of the causes of the Great Recession was overuse of credit. Over the last 10 years, the rate of credit growth has been historically low likely caused by:
- the boomers (and the adult population in general) shift away from credit based purchases;
- lower rate of inflation. This can work against borrowing more as one is paying back with less-inflated money.
However, the long term growth trend rate also logically must not be higher than population growth plus inflation (say 3% currently). With student loans counted, consumer credit growth is 5.9% (without 2.5% – see figure 2).
Figure 4: Annual Growth Rate of Consumer Credit less student loans (blue line) and Annual Growth Rate of Inflation plus Population (red line)
It could be argued that the USA consumer based economy is currently about as good as it can get until higher inflation sets in or a new dynamic begins driving the economy. Low inflation works against credit growth. And low consumer credit growth works against GDP growth.
Other Economic News this Week:
The Econintersect economic forecast for June 2012 again declined marginally, and remains under a zone which would indicate the economy is about to grow normally. The concern is that consumers are spending a historically high amount of their income.
The ECRI WLI growth index value has been weakly in positive territory for over four months – but in a noticeable improvement trend. The index is indicating the economy six month from today will be slightly better than it is today.
Current ECRI WLI Growth Index
Initial unemployment claims degraded from 343,000 (reported last week) to 360,000 this week. Historically, claims exceeding 400,000 per week usually occur when employment gains are less than the workforce growth, resulting in an increasing unemployment rate.
The real gauge – the 4 week moving average – improved from 345,500 (reported last week) to 351,750. Because of the noise (week-to-week movements from abnormal events AND the backward revisions to previous weeks releases), the 4-week average remains the reliable gauge.
Weekly Initial Unemployment Claims – 4 Week Average – Seasonally Adjusted – 2011 (red line), 2012 (green line), 2013 (blue line)
Bankruptcies this Week: Hoku, Tootie Pie Company
Data released this week which contained economically intuitive components(forward looking) were:
- Rail movements are beginning to show a modest growth trend.
All other data released this week either does not have enough historical correlation to the economy to be considered intuitive, or is simply a coincident indicator to the economy.
Weekly Economic Release Scorecard:
Click here to view the scorecard table below with active hyperlinks