
It has a Fundamental Analysis Score of 28 and a CapitalCube Implied Price of INR 133.65.
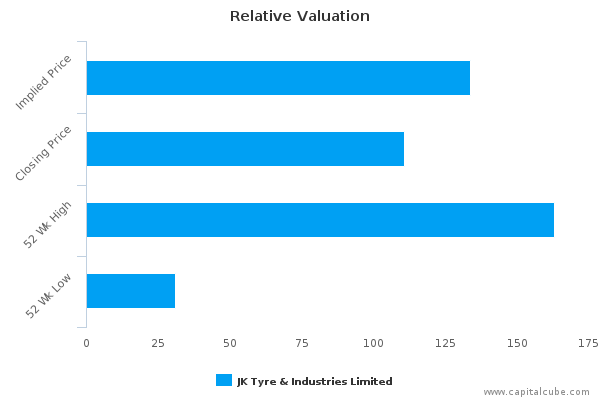
Relative Valuation
JK Tyre & Industries (NSE:JKIN) is currently neutrally valued, as its previous close of INR 110.60 lies within the CapitalCube estimate range of INR 105.06 to INR 162.23. Over the last 52 week period, JK Tyre & Industries Limited has fluctuated between INR 30.84 and INR 162.95.
Company Overview
- Relative outperformance over the last year is in contrast to the more recent underperformance.
- JK Tyre & Industries Limited's current Price/Book of 2.29 is about median in its peer group.
- The market expects 530007-IN to grow at about the same rate as the peers and to maintain the median returns it currently generates.
- 530007-IN has relatively low profit margins and median asset efficiency.
- Changes in annual revenues are in line with its chosen peers but lags in terms of earnings suggesting that the company is less cost conscious and may be spending for growth.
- 530007-IN‘s return on assets currently and over the past five years has trailed the peer median and suggests the company might be operationally challenged relative to its peers.
- The company's median gross margin and relatively low pre-tax margin suggest high operating costs versus peers.
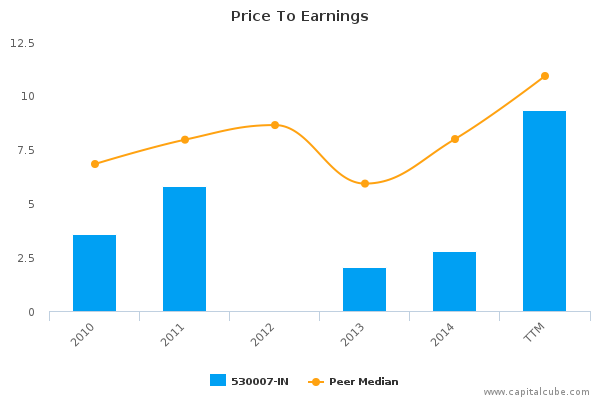
- 530007-IN‘s revenue growth in recent years and current PE ratio are both around their respective peer medians suggesting that historical performance and long-term growth expectations for the company are largely in sync.
- The company seems to be over-investing in a business with median returns.
- 530007-IN seems to be constrained by the current level of debt.
Investment Outlook
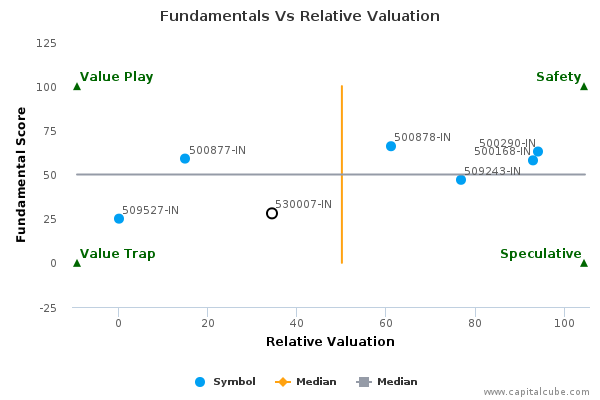
JK Tyre & Industries Limited has a fundamental score of 28 and has a relative valuation of NEUTRAL.
JK Tyre & Industries Limited lies at the bottom left quadrant of CapitalCube's Value – Price Matrix. We call this space a Value Trap. At this level, JK Tyre & Industries Limited is potentially undervalued, since it trades lower than its CapitalCube Implied price of 133.65. However, its fundamental analysis score is also on the lower side at 28, begging the question whether the low price is on account of the weaker fundamentals.
Drivers of Valuation
The market expects 530007-IN to maintain the median rates of return it generates currently.
The market expects 530007-IN to grow at about the same rate as its chosen peers (PE of 9.34 compared to peer median of 10.92) and to maintain the peer median return (ROE of 26.84%) it currently generates.
The company's current Price/Book of 2.29 is about median in its peer group.
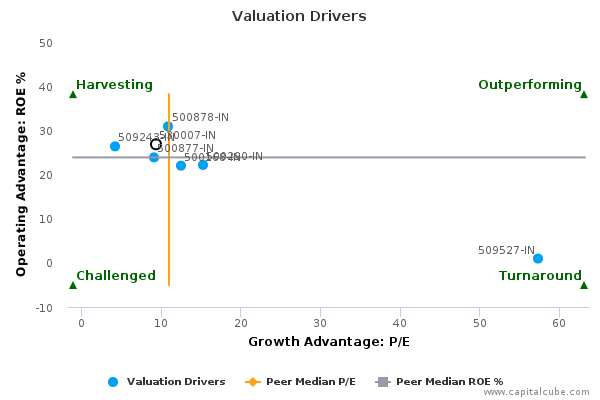
530007-IN has moved towards a median ROE and PE from a relatively low PE profile at the recent year-end.
, P/E")
Peer Analysis
A complete list of valuation metrics is available on the company page.
Company Profile
JK Tyre & Industries Ltd. manufactures and markets tyres, tubes and flaps. The company caters its products to various categories such as cars, trucks, buses, light trucks and off-the road vehicles. Its tyres are specifically designed in accordance to the different loading and application requirements of its customers. The company markets its products under the JK Tyre and Vikrant brand names. JK Tyre & Industries was founded on February 14, 1951 and is headquartered in New Delhi, India.
Disclaimer
The information presented in this report has been obtained from sources deemed to be reliable, but AnalytixInsight does not make any representation about the accuracy, completeness, or timeliness of this information. This report was produced by AnalytixInsight for informational purposes only and nothing contained herein should be construed as an offer to buy or sell or as a solicitation of an offer to buy or sell any security or derivative instrument. This report is current only as of the date that it was published and the opinions, estimates, ratings and other information may change without notice or publication. Past performance is no guarantee of future results. Prior to making an investment or other financial decision, please consult with your financial, legal and tax advisors. AnalytixInsight shall not be liable for any party's use of this report.
AnalytixInsight is not a broker-dealer and does not buy, sell, maintain a position, or make a market in any security referred to herein. One of the principal tenets for us at AnalytixInsight is that the best person to handle your finances is you. By your use of our services or by reading any our reports, you're agreeing that you bear responsibility for your own investment research and investment decisions. You also agree that AnalytixInsight, its directors, its employees, and its agents will not be liable for any investment decision made or action taken by you and others based on news, information, opinion, or any other material generated by us and/or published through our services. For a complete copy of our disclaimer, please visit our website www.analytixinsight.com.