
J. C. Penney Company Inc. (NYSE:JCP) reported adjusted loss per share of 5 cents in the second quarter of fiscal 2016, narrower than the Zacks Consensus Estimate of loss of 15 cents. In the year-ago quarter, the company’s adjusted loss was 40 cents a share. Including one-time items, J. C. Penney reported quarterly loss of 18 cents a share, lower than a loss of 38 cents in the year-ago quarter.
The company’s total net sales of $2,918 million missed the Zacks Consensus Estimate of $2,933 million but increased 1.5% year over year, after witnessing a decline of 1.6% in the preceding quarter. Comparable-store sales (comps) jumped 2.2% from the year-ago quarter, after decreasing 0.4% in the preceding quarter.
Sturdy performance was witnessed across Sephora, Home, and Footwear and Handbags divisions. Management remains optimistic about its roll out of appliances, new Sephora locations, center core refreshes, in-store .com fulfillment and buy online, pick up in store same day initiative.
Gross profit in the quarter climbed 1.8% to $1,084 million, while gross margin expanded 10 basis points (bps) to 37.1%. J. C. Penney’s adjusted EBITDA improved to $233 million from $138 million in the prior-year quarter, whereas adjusted EBITDA margin increased 320 bps to 8%.
PENNEY (JC) INC Price, Consensus and EPS Surprise
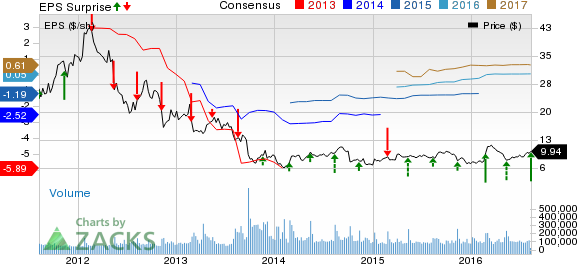
PENNEY (JC) INC Price, Consensus and EPS Surprise | PENNEY (JC) INC Quote
Financial Details
J. C. Penney ended the quarter with cash and cash equivalents of $429 million, long-term debt of $4,356 million and shareholders’ equity of $1,197 million. Merchandise inventory levels decreased 0.8% to $2,981 million.
Moreover, the company generated free cash flow of $69 million in the reported quarter compared with negative free cash flow of $53 million in the prior-year quarter. Also, the company incurred capital expenditures of $121 million in the quarter.
Guidance
For fiscal 2016, management continues to expect comps growth of 3–4%. The company expects gross margin to increase in the range of 10–30 bps. Adjusted earnings per share are likely to be positive in fiscal 2016. EBITDA is expected at around $1 billion.
Zacks Rank
At present, J. C. Penney carries a Zacks Rank #3 (Hold). Better-ranked stocks in the retail sector include American Eagle Outfitters, Inc. (NYSE:AEO) , Dillard's Inc. (NYSE:DDS) and The Children's Place, Inc. (NASDAQ:PLCE) all carrying a Zacks Rank #2 (Buy).
AMER EAGLE OUTF (AEO): Free Stock Analysis Report
CHILDRENS PLACE (PLCE): Free Stock Analysis Report
DILLARDS INC-A (DDS): Free Stock Analysis Report
PENNEY (JC) INC (JCP): Free Stock Analysis Report
Original post
Zacks Investment Research