
Put to call ratios are a permanent fixture in my indicator stable and something I have been writing about for a number of years, including an early 2007 effort, A Sentiment Primer (Long).
My perennial favorite of all the off-the-shelf put to call ratios actually inverts the traditional ratio: the ISEE equities only call to put ratio. This ratio only counts opening options purchases and excludes index and ETF products so as to provide a more targeted approach to divining what sort of speculative trades retail investors are favoring.
What got my attention yesterday was that in reviewing the components of my proprietary Aggregate Market Sentiment Indicator (AMSI) for the newsletter, I saw that the ISEE equities only call to put ratio closed under 120 (meaning less than 120 opening call purchases per 100 opening put purchases) for three consecutive days for the first time since March 6, 2009 – the date when the SPX put in its post-crisis bottom at 666 and began what has now been a bull leg that has lasted more than four years. Not surprisingly, this kind of hat trick is typically associated with conditions in which stocks are extremely oversold and ripe for a bounce, as appears to be the case today and was certainly the case in March 2009.
For the record, the ISEE equities only call to put ratio is back in the middle of its traditional range today, most recently at 178, as the financial markets are discovering some sort of normalcy – at least outside of the context of the Japanese yen.
The chart below shows the ISEE equities only call to put ratio, using closing values for the past month, as of yesterday’s close.
Note that the ISEE ratios come in two other flavors: an index that is limited to index and ETF transactions; and an all securities index which combines the equities only data and the index + ETF data. Current and historical data for all three versions of the ISEE call to put ratios, as well as an interactive chart, are available at the ISEE Index page. 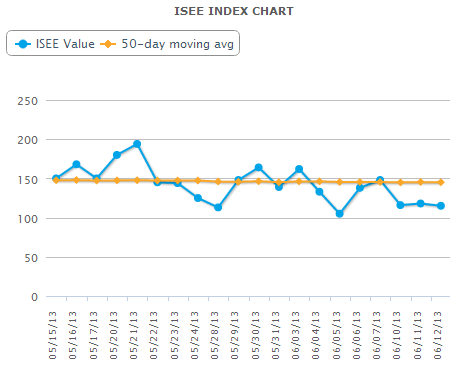
Disclosure(s): none
- English (UK)
- English (India)
- English (Canada)
- English (Australia)
- English (South Africa)
- English (Philippines)
- English (Nigeria)
- Deutsch
- Español (España)
- Español (México)
- Français
- Italiano
- Nederlands
- Português (Portugal)
- Polski
- Português (Brasil)
- Русский
- Türkçe
- العربية
- Ελληνικά
- Svenska
- Suomi
- עברית
- 日本語
- 한국어
- 简体中文
- 繁體中文
- Bahasa Indonesia
- Bahasa Melayu
- ไทย
- Tiếng Việt
- हिंदी
ISEE Equities Only Index: Call To Put Ratio Closes Under 120
Published 06/13/2013, 05:07 PM
Updated 07/09/2023, 06:31 AM
ISEE Equities Only Index: Call To Put Ratio Closes Under 120
3rd party Ad. Not an offer or recommendation by Investing.com. See disclosure here or
remove ads
.
Latest comments
Install Our App
Risk Disclosure: Trading in financial instruments and/or cryptocurrencies involves high risks including the risk of losing some, or all, of your investment amount, and may not be suitable for all investors. Prices of cryptocurrencies are extremely volatile and may be affected by external factors such as financial, regulatory or political events. Trading on margin increases the financial risks.
Before deciding to trade in financial instrument or cryptocurrencies you should be fully informed of the risks and costs associated with trading the financial markets, carefully consider your investment objectives, level of experience, and risk appetite, and seek professional advice where needed.
Fusion Media would like to remind you that the data contained in this website is not necessarily real-time nor accurate. The data and prices on the website are not necessarily provided by any market or exchange, but may be provided by market makers, and so prices may not be accurate and may differ from the actual price at any given market, meaning prices are indicative and not appropriate for trading purposes. Fusion Media and any provider of the data contained in this website will not accept liability for any loss or damage as a result of your trading, or your reliance on the information contained within this website.
It is prohibited to use, store, reproduce, display, modify, transmit or distribute the data contained in this website without the explicit prior written permission of Fusion Media and/or the data provider. All intellectual property rights are reserved by the providers and/or the exchange providing the data contained in this website.
Fusion Media may be compensated by the advertisers that appear on the website, based on your interaction with the advertisements or advertisers.
© 2007-2024 - Fusion Media Limited. All Rights Reserved.