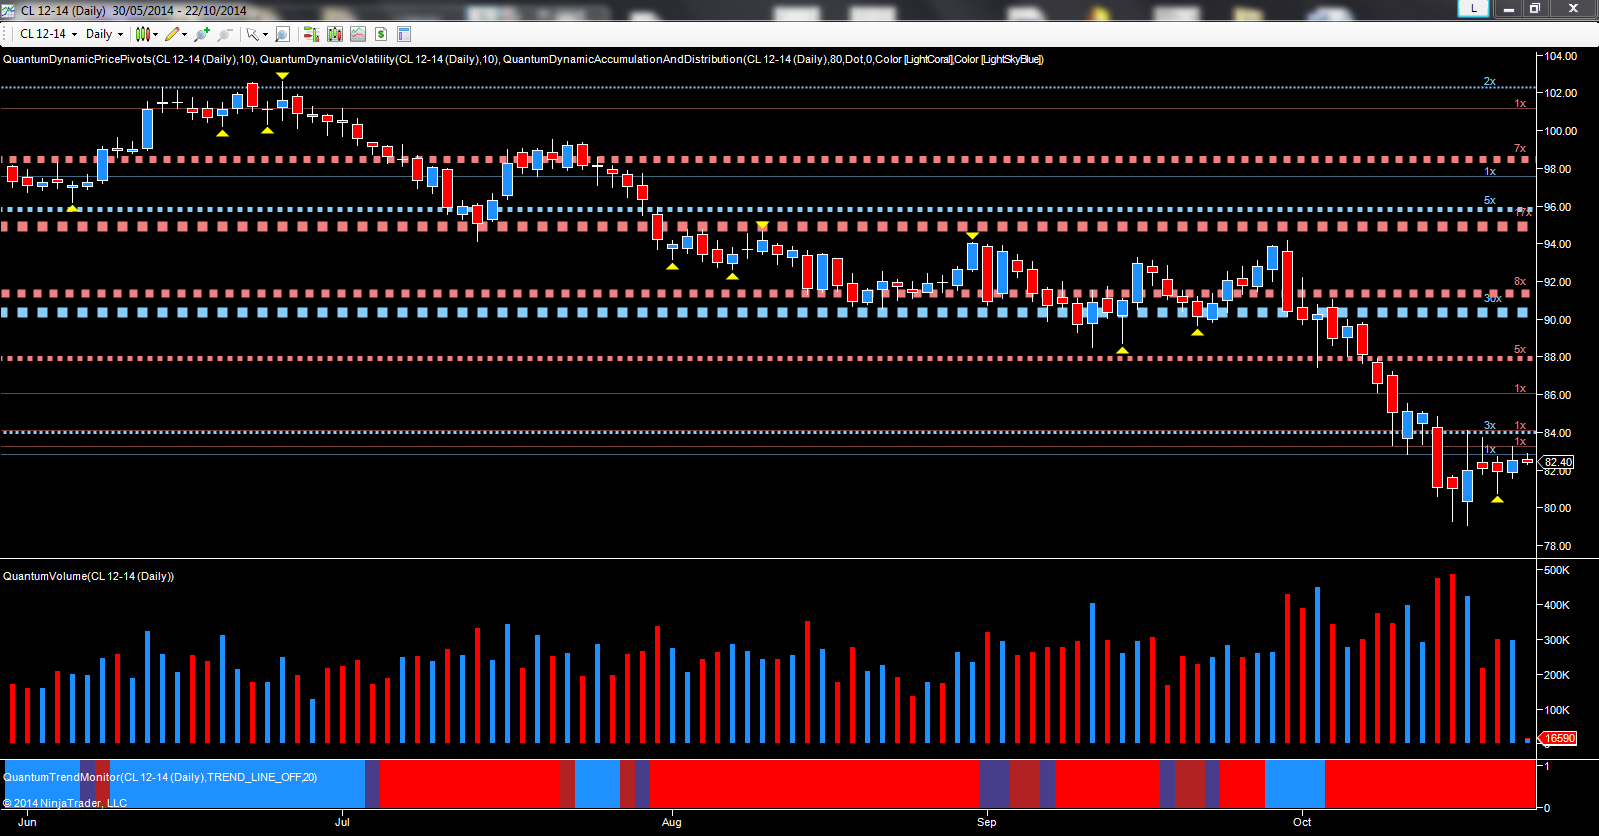
The last few days have been interesting ones for crude oil traders, with the commodity mirroring the volatile price action and associated volume profiles of related markets, and suggesting in turn, that we may be approaching a pause, and possible bottom to the current bearish trend.
If we scroll back to Tuesday last week for the December WTI contract, this was the day which signaled the start of the next leg down in the bearish trend, closing with a wide spread down candle on ultra high volume and breaking through the key support platform in the $84 per barrel region. The following day, then proved to be seminal, with the first clear sign of heavy buying by the big operators, with the price action closing as a hammer candle, but again with ultra high volume, having tested the low of $79.27 before recovering as the buyers move in to close at $81.04 per barrel. In any down move, stopping volume is always the pre-cursor to any move into congestion and any subsequent reversal, of which this was a classic example. The following day then confirmed the appearance of buyers with the WTI price moving higher to test the $84 per barrel region, but closing with a deep upper wick to the candle, signaling a weak response and a market not yet ready to reverse the current trend. Friday’s price action then confirmed this weakness with a second test of this level on average volume.
The week then began with a test of supply on average volume sending two signals. First, that the big operators are preparing for a rally, and second, that the test of supply suggests that the remaining selling pressure has yet to be absorbed. Nevertheless, given the price action over the last few days, oil prices now appear to be building a base in the $79 per barrel region. Given the test of supply of Monday and consequent result, we may see some further downside momentum and an extended phase of price congestion between the $79 per barrel region to the downside and the $84 per barrel level to the upside as any residual selling is absorbed, with a classical congestion phase following as a result.
Today sees the weekly release of oil inventories, with a forecast of a build of 2.8mbbls in sharp contrast to last week’s build of 8.9mbbls, but reflecting the slowdown in demand globally. The bright spot at present is China with the forecast for growth earlier in the week beating expectations for GDP at 7.3% against a forecast of 7.2%, but well below last quarter’s 7.5%, with the market breathing a collective sign of relief. However, the supply demand equation for oil continues to remain imbalanced, with OPEC reducing prices for Asian markets rather than reducing supply, protecting market share in the region.
