Get 40% Off
These stocks are up over 10% post earnings. Did you spot the buying opportunity? Our AI did 😎Read how

Is It Time To Short Gold?

Published 01/11/2017, 03:18 PM
Updated 07/09/2023, 06:32 AM

After the press conference of elect President Donald Trump, gold seems to have gone with the flow, naturally increasing in value. However, technically the commodity is showing some signs of weakness. Fundamentally, it is not yet clear what the future hides.

However, if we start with the daily timeframe, we can see it approaching a good resistance zone within the interval of 1200 - 1205, as well as a 72 day moving average which will reinforce convictions of at least a correction, if not going down to the previous support situated around 1185 - 1190
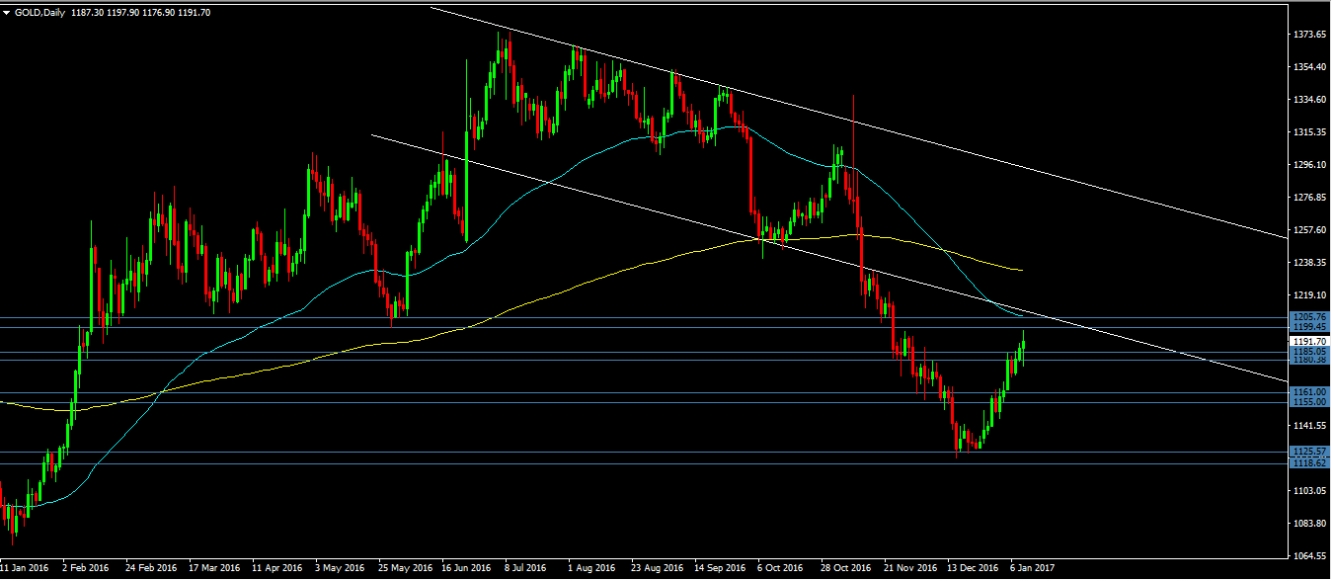
Gold Daily Chart

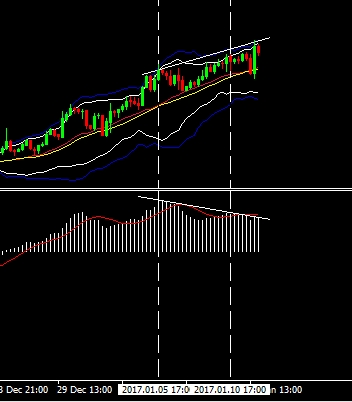
Now if we check smaller timeframes, we can further see that it is probably showing the reversal signs predicted in the daily timeframe. Here are two charts, the first a 4 hour chart showing the normal support and resistance levels (yellow moving average 200, blue moving average 50), and the second graph shows a divergence of the price of gold with the MACD, which could mean a potential weakness in the uptrend. But who knows what this unpredictable metal would do in the future?
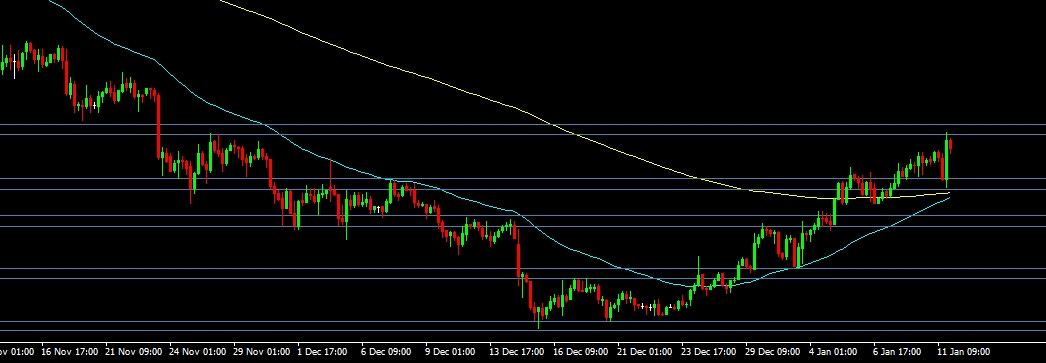
Gold 4 Hour Chart
Gold 4 Hour MACD Divergence Chart

Latest comments

Risk Disclosure: Trading in financial instruments and/or cryptocurrencies involves high risks including the risk of losing some, or all, of your investment amount, and may not be suitable for all investors. Prices of cryptocurrencies are extremely volatile and may be affected by external factors such as financial, regulatory or political events. Trading on margin increases the financial risks.
Before deciding to trade in financial instrument or cryptocurrencies you should be fully informed of the risks and costs associated with trading the financial markets, carefully consider your investment objectives, level of experience, and risk appetite, and seek professional advice where needed.
Fusion Media would like to remind you that the data contained in this website is not necessarily real-time nor accurate. The data and prices on the website are not necessarily provided by any market or exchange, but may be provided by market makers, and so prices may not be accurate and may differ from the actual price at any given market, meaning prices are indicative and not appropriate for trading purposes. Fusion Media and any provider of the data contained in this website will not accept liability for any loss or damage as a result of your trading, or your reliance on the information contained within this website.
It is prohibited to use, store, reproduce, display, modify, transmit or distribute the data contained in this website without the explicit prior written permission of Fusion Media and/or the data provider. All intellectual property rights are reserved by the providers and/or the exchange providing the data contained in this website.
Fusion Media may be compensated by the advertisers that appear on the website, based on your interaction with the advertisements or advertisers.
© 2007-2024 - Fusion Media Limited. All Rights Reserved.