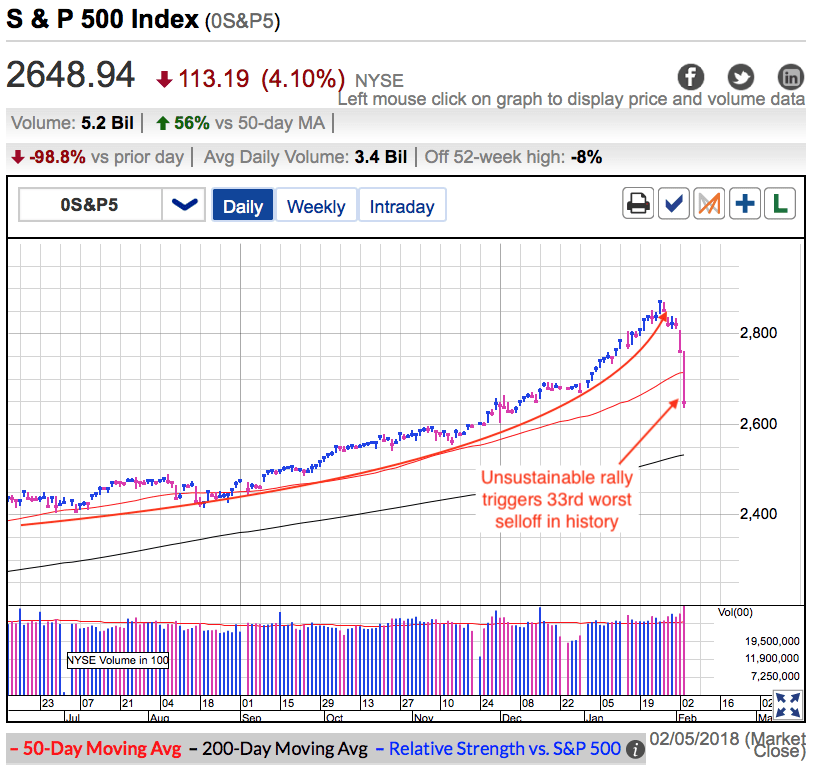
Typically I publish free posts on Tuesday and Thursday evenings, but Monday’s bloodbath warrants a special edition. The financial press loves a catchy headline and they cannot resist calling this the worst selloff in market history. Technically they’re correct if we measure points, but that is misleading and it is far more useful to compare percentages. And while Monday's 4% loss wasn’t anywhere near the worst (-22%), it did rank as the 33rd worst loss in history.
The most shocking thing about this 33rd worst loss is we didn’t have a significant headline driving it. Far smaller selloffs accompanied Trump’s nuclear standoff with North Korea, the U.K. abandoning Europe, government shutdowns, sequesters, fear of the euro collapsing, and every other headline since 2011. The last time the market fell this far was when S&P downgraded U.S. debt because Republicans were threatening default.
There have been countless frightening headlines over the years, but few of them have spooked the market as badly as it was spooked today. And even more strange is the economic outlook today is no different than it was last week. In fact a big part of the reason people started selling last Friday is because things were “too good” and the Fed might be forced to hike interest rates faster than previously expected. Since when does “too good” trigger one of the biggest down days in market history?
Obviously this selloff is not driven by fundamentals because the fundamentals are fine. And while valuations are a little stretched, they are not obscenely overvalued given the strong economic outlook. The only thing left is technical and structural selling. Many sellers were selling for no other reason than we passed some arbitrary stop-loss level. The first wave of stop-loss selling pushed us down and triggered the next wave of stop-loss selling.
It didn’t take long before this reactive selling pushed us so far we broke underlying structural components. Weeks or months from now we will learn an over-leveraged hedge fund found itself in a world of hurt and margin calls forced indiscriminate selling, adding fuel to the already hot fire. Or maybe one of these exotic leveraged, inverse, and derivative ETF’s blew up spectacularly. Apparently (NASDAQ:XIV), an inverse volatility ETF that was worth $1.5 billion a few days ago lost 90% of its value in after-hours trade when the derivatives it was based on became worthless.
I’ve been warning readers the market is never easy and at some point this relentless climb was going to come back to haunt us. And while I’d love to take credit for predicting this collapse, not in my wildest imagination did I expect it to trigger the 33rd worst day in market history. I knew we were vulnerable and the risks were elevated, but I was expecting a normal and routine dip back to support so we could consolidate gains. The selloff would be a little larger and more dramatic than normal due to the size of the run-up, but I most definitely didn’t foresee a collapse. And maybe the market started with a normal pullback, but the routine selling unexpectedly spiraled out of control and triggered bigger waves of panic selling, which in turn lead to failures in hedge funds and exotic ETFs.
But all of this is already old news and most of us want to know what is coming next. There is another blood bath in overnight futures and things don’t look good for Tuesday. If we open at these levels, every buy over the last four-months will be underwater, and that could lead to another round of indiscriminate and reactive selling. But the thing to remember is there is nothing of substance behind this selloff. Maybe we went a little too-high, too-fast, but that doesn’t justify a market collapse. The plus side of this selloff is we can now stop talking about how many days it’s been since a 5% selloff. We checked that one off and if we open at these overnight futures levels, we can cross a 10% selloff off the list too. But there is still nothing to this selloff and we are close to the end.
For those of us that took risk off the table during this run-up and have cash to spend, this dip is extremely attractive. The most profitable opportunities come from the most emotional times. Traders are scared of selling at steep discounts “before things get worse”. But I don’t think it is going to get a whole lot worse. Tuesday will likely start ugly, but a mid-day rebound from the lows could be the end of the selloff. And while it feels risky to jump in, remember risk is a function of height and it’s been several months since the market was this safe. It was risky to chase stocks higher last week. It is a hell of a lot safer to chase these discounts today.
I wanted to write about Bitcoin's plunge, but that will have to wait until later.
