Where've we heard that judgment before? Yours truly has so written of Gold's being oversold, as have others of our analytical ilk, it seems too often these past two years. For just when we sense 'tis as low as it can go -- especially when valued against global currency debasement -- Gold gets frog-marched to the back of the plane and thrown out the door. And given Gold's losing 58 points this past week, to repeatedly so do would put the price at zero ("0") for the week ending 26 March 2015. One has to think the Shorts are planning quite the celebration for that event in just 21 weeks' time.
But seriously folks, if Gold, as we oft put forth, "plays no currency favourites", should it not have soared yesterday (Friday) upon the Bank of Japan's announcing a 60% increase in its annual Bond purchase ceiling, a tripling of their exchange-traded funds and real estate investment trust purchases, and a doubling of their equities purchases? That's a lot of purchases, which to be enabled necessitates a yen by the BOJ to create oodles of ¥en, well beyond the number of noodles in your ramen. Place scapegoat blame on falling deflationary Oil prices, but when your central bank fails to meet its bond-buying goal and your government raises its consumption tax, history shows us that this ought end badly for one's economy, given Japan's being largely driven by consumer spending, as is ours StateSide. (Note to Federal Reserve Bank: raise interest rates next year and then observe the effect of variable rate debt on the consumer ... "Yo Mabel, we're gonna hafta cut back on those Saturday night dinners down at Patty's Pork Palace!"). Pass the Bone Suckin' Sauce, please.
In any event, the BOJ is now poised to ultimately add hundreds of trillions of ¥en to the global money supply in the face of an essentially fixed global Gold supply, (especially given the subdued mining activity these last couple of years). But a bad ¥en yields to a bodacious Buck, the Dollar Index thus rising yesterday to as high as 87.245, a level not seen since our San Francisco Giants won their first World Series, (let alone now their third), back in 2010. Yet Dollar Bulls take heed: your Index is closing in on where it peaked both in March 2009 (89.710) and in June 2010 (89.100). Moreover, here at 87.055, said Dollar Index is now just a mere 47% below its all-time high of 164.720 from February 1985.
"Well that's not very impressive for the Dollar when you put it that way, mmb..."
Of course 'tis not, Squire, and that's exactly the point. But once again, there's currently that investing impetus which fosters "Dollar strength", when combined with our own Fed's termination of Quantitative Easing, (being reported upon as if the latter's demise wasn't already priced into Gold), saw the yellow metal get royally slammed down as much as -3.2% yesterday alone, the intra-day low of 1161 being its nethermost level since 29 July 2010. As for the increase in the Dollar Index, we naturally view this in part as a transactional shift from one bow-wow currency (¥) into another ($), and obviously thus remain fully on deck for the fundamental flight from such dog currencies at large into the consummate currency: Gold. And I wouldn't be discouraged a wit from buying more Gold right now, even if cognizant that the negative technicals could well bring us lower still, for presently, Gold is now WAY oversold as we'll herein unfold. But first: to Gold's Weekly Bars and the accelerating negative pull on the parabolic Short trend:
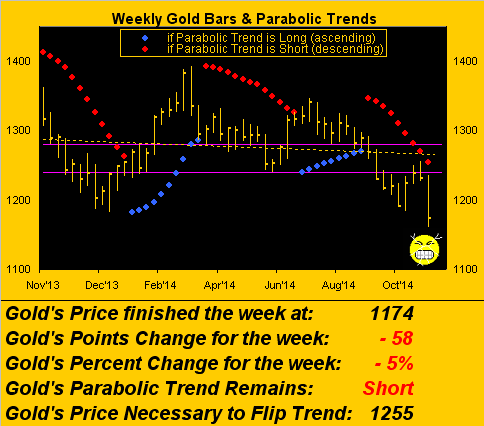
On a percentage basis, 'twas Gold's worst losing week since that ending 28 June 2013, and on a points basis since that ending 13 September 2013. (Lot's of 13s for you superstitious WestPalmBeachers down there). However, let us proceed with three specific examples as to why we see that Gold is now WAY oversold.
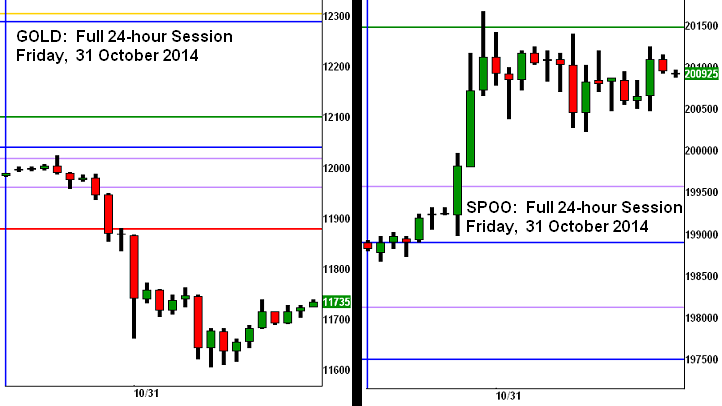
Gold Oversold Part Un: The following two-panel chart shows us just how downside overcooked Gold got yesterday. The left-hand panel is Gold's full 24-hour Friday session, (which here in the Pacific time zone runs from 15:00 Thursday through 14:15 Friday). The right-hand panel is the same time frame for the S&P 500 futures ("Spoo"). On the Gold panel at left, please observe the horizontal red line, which we "fix" on the chart before the trading session begins. Familiar to those who follow the Market Ranges page at the website, the red line is the "expected low" for Gold's session should it be a down day: talk about "going over the line"! Gold exceeded the red line by -2.3%! Moreover, the Dollar Index only exceeded its "high if an up day line" by +0.6%. Which in turn for the Spoo panel at right is its green horizontal line, the S&P topping out essentially at its "expected high" for an up session. Further, see the gold-coloured line near the very top of the Gold panel? That's its Market Magnet from which price rarely strays a great distance; contrarily, the S&P's Market Magnet was so low coming into Friday (1936), 'tis not even remotely close to showing on the chart, (suggesting, naturally, that the S&P is terrifically overbought):
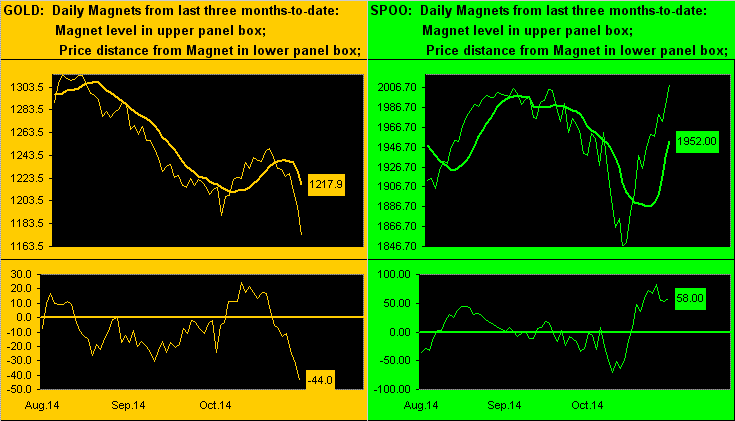
Gold Oversold Part Deux: So, having mentioned the Market Magnets for both Gold and the Spoo, here they are side-by-side for the last three months-to-date. In both panels, the smoother line is the Market Magnet, (the current reading in the box), and the oscillator in both panels' lower portions represents price less magnet. For these two markets, price is at an extreme distance from magnet:
Gold Oversold Part Trois: Similarly over these three months, here are Gold and the Spoo vis-à-vis their smooth, pearly valuation lines, (the oscillators in this case being price less valuation). The valuation line represents a product's price movements relative to those that comprise the five "primary" BEGOS Markets (Bond / Euro / Gold / Oil / S&P) as they all interactively respond to one another. On the left for Gold, its valuation line is actually flattening, the oscillator getting near that -50 extreme, whilst on the right for the S&P, its valuation line is curling southward, with the oscillator at an upside extreme. And yes, we remain on "crash watch" for the S&P, especially given its recent dip was not even a full -10%:

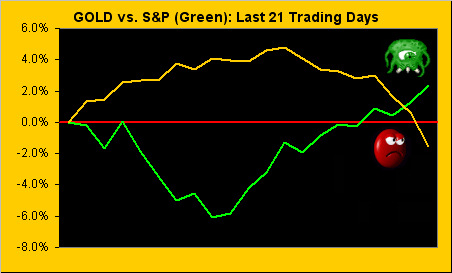
So there's no question that yesterday upon price's getting rip-snort-bashed upside the head, (just short of being served up with a side of fries), that Gold is now WAY oversold. Yet when viewed below on a month-over-month basis versus the SpooMonster, Gold is just -2% and the S&P just +2% as shown, the yellow metal nonetheless in full embarrassing blush, if not oversold rage:
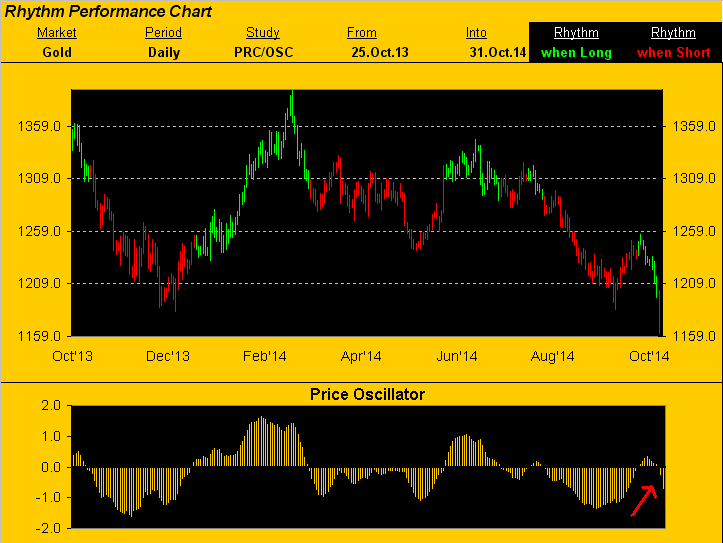
Admittedly, from the "We Were Worried This Might Happen Dept.", 'tis obligatory to again bring up the year-over-year chart of Gold's daily bars, which are green when the daily Price Oscillator study is positive, and red when negative. And as much as we deplore the notion of going Short Gold, the right-most red bar would have had one Short from the get-go yesterday, for as you can see in the oscillator at the foot the chart, it confirmed turning negative (red arrow) as of Thursday's close:
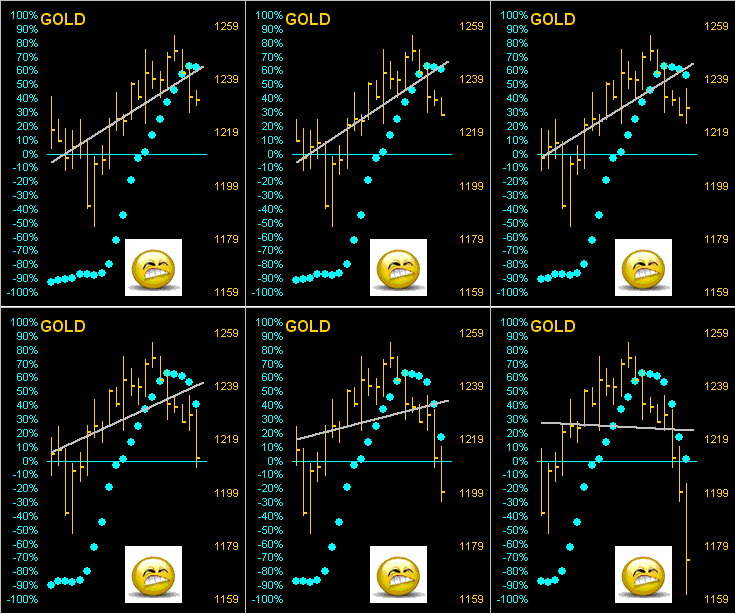
At this time just a week ago, Gold was sporting the steepest 21-day linear regression uptrend line of all eight BEGOS markets, (the three "secondary" ones not cited earlier being the Swiss Franc, Silver and Copper). Now you might consider a dosage of meclizine ahead of viewing this next moving (literally) chart. Commencing from Friday a week ago when Gold was 1231 through yesterday's close at 1174, here's how this 21 daily bars chart progressed, along with the diagonal trend line and "Baby Blues" representative of trend consistency, it all falling 'round our queasy friend down there:
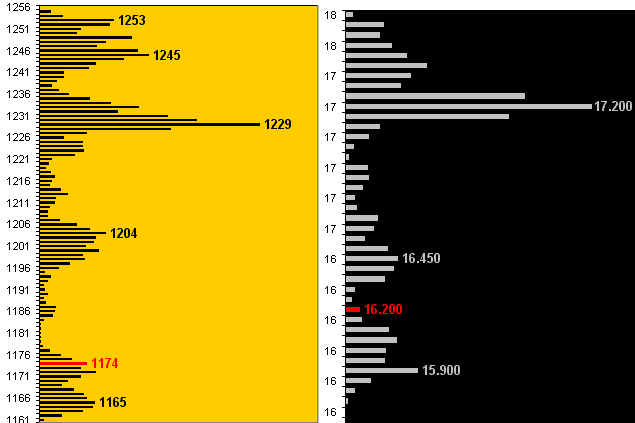
Next to Gold's 10-day Market Profile we go, along with that on the right for Sister Silver, who's had to hock her precious metal pinstripes at the local pawnbroker for a roll of phony-feeling El Cheapo quarters in order to eat. The red bars are the two markets' respective Friday rounded settles:
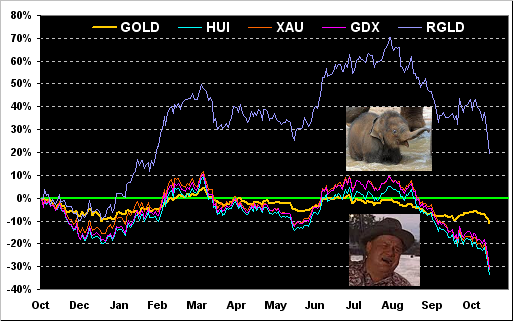
Finally, as the calendar has flipped to November, here we've the year-over-year view of Gold alongside its maniacally struggling Precious Metals Equity Buddies, those being the Gold Bugs Index ("HUI"), Philly Exchange Precious Metals Index ("{{XAU}}"), the exchange-traded fund of mining companies ("Market Vectors Gold Miners (ARCA:GDX)") and the always alacritive royalty company Royal Gold ("RGLD"). And again to quote Sheriff J. W. Pepper from his face-to face conversation with a baby Thai elephant in the 1974 Eon Productions film "The Man With The Golden Gun", putting it in perspective for the Gold equities: "Man... you is ugly.", (following which the good sheriff was summarily shunted by the elephant into Bangkok's Chao Phraya River):
So hopefully you've gleaned why we presently see Gold, (albeit not for the first time), as WAY oversold.
Next week's 260th presentation of The Gold Update with be the Fifth Anniversary Edition. Over these five years, we've written on occasion that our biggest concern toward thwarting Gold's natural rise with rampant foundationless currency creation would be a deflationary depression, characterized by shrinking asset values. Japan is fighting this as is the EuroZone, all the while flooding their respective central banks with assets purchased by magic money. StateSide, we've so stopped (for the present) and one has to only look at one's checkbook ledger to see that we're inflationarily spending more at the store for the same basket of goods than we did a year before. One might therefore conclude that globally, economies are actually in a confused state of "deinflation". But soon the Dollar tumblers shall again rumble as interest rates backing up stab their epée into the economy and the rise in our M2 money supply shall be on the move once again, as we envision shall be the price of Gold. To which end we're adding a new opening featuring to The Gold Update starting with next week's landmark edition. And I think you'll like what you see (!)