
Value investing is easily one of the most popular ways to find great stocks in any market environment. After all, who wouldn’t want to find stocks that are either flying under the radar and are compelling buys, or offer up tantalizing discounts when compared to fair value?
One way to find these companies is by looking at several key metrics and financial ratios, many of which are crucial in the value stock selection process. Let’s put Enova International, Inc. (NYSE:ENVA) stock into this equation and find out if it is a good choice for value-oriented investors right now, or if investors subscribing to this methodology should look elsewhere for top picks:
PE Ratio
A key metric that value investors always look at is the Price to Earnings Ratio, or PE for short. This shows us how much investors are willing to pay for each dollar of earnings in a given stock, and is easily one of the most popular financial ratios in the world. The best use of the PE ratio is to compare the stock’s current PE ratio with: a) where this ratio has been in the past; b) how it compares to the average for the industry/sector; and c) how it compares to the market as a whole.
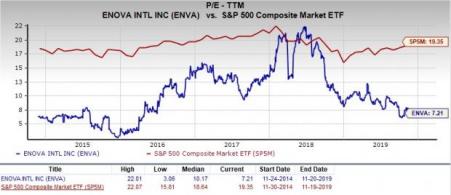
On this front, Enova International has a trailing twelve months PE ratio of 7.21, as you can see in the chart below:
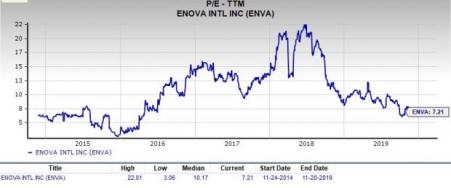
This level actually compares quite favorably with the market at large, as the PE for the S&P 500 stands at about 19.35. Also, if we focus on the long-term PE trend, Enova International’s current PE level puts it below its midpoint of 10.17 over the past five years.
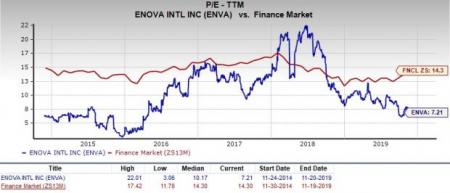
The stock’s PE also compares quite favorably with the Finance Market’s trailing twelve months PE ratio, which stands at 14.3. This indicates that the stock is undervalued right now, compared to its peers.
Meanwhile Enova International has a forward PE ratio (price relative to this year’s earnings) of 5.38, which is lower than the current level. So, so it is fair to say that a more value-oriented path lies ahead of the stock in the near term.
P/S Ratio
Another key metric to note is the Price/Sales ratio. This approach compares a given stock’s price to its total sales, where a lower reading is generally considered better. Some people like this metric more than other value-focused ones because it looks at sales, something that is far harder to manipulate with accounting tricks than earnings.
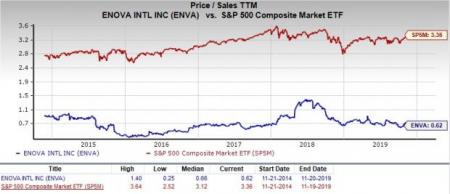
Right now, Enova International has a P/S ratio of 0.62. This is quite lower than the S&P 500 average, which comes in at 3.36x right now. Also, as we can see in the chart below, this is much below the highs for this stock in particular over the past few years.
Broad Value Outlook
In aggregate, Enova International currently has a Value Score of A, putting it into the top 20% of all stocks we cover from this look. This makes Enova International a solid choice for value investors.
What About the Stock Overall?
Though Enova International might be a good choice for value investors, there are plenty of other factors to consider before investing in this name. In particular, it is worth noting that the company has a Growth Score of A and a Momentum Score of A. This gives ENVA a Zacks VGM score — or its overarching fundamental grade — of A. (You can read more about the Zacks Style Scores here >>).
Meanwhile, the company’s recent earnings estimates have been bullish. While the current-quarter estimate has seen one upward and one downward movement, the current-year estimate has seen two upward and one downward movement over the past two months.
This has had a positive effect on the consensus estimate. While the current-quarter consensus shot up 18.4% over the past two months, the current-year estimate has climbed 10.3%. You can see the consensus estimate trend and recent price action for the stock in the chart below:
Enova International, Inc. Price and Consensus
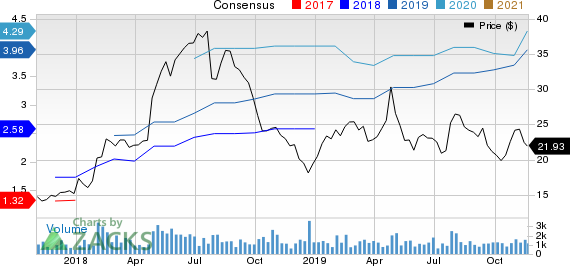
Enova International, Inc. price-consensus-chart | Enova International, Inc. Quote
Such bullish analyst sentiments is the reason why the stock has a Zacks Rank #1 (Strong Buy) and why we are looking for outperformance from the company in the near term.
Bottom Line
Enova International is an inspired choice for value investors, as it is hard to beat its incredible lineup of statistics on this front. Besides a strong industry rank (among Top 35% of more than 250 industries), a Zacks Rank #1, instils investors’ optimism in the stock.
However, over the past two years, the broader industry has clearly underperformed the market at large, as you can see below:
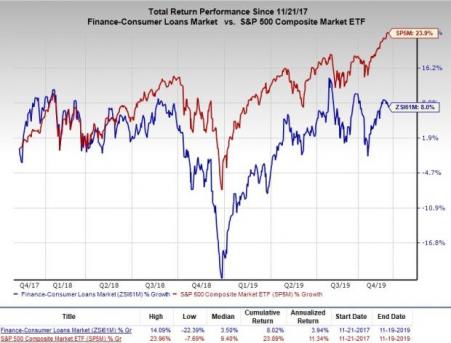
We believe, despite an unsatisfactory past industry performance, a good industry and Zacks rank and upbeat analyst sentiments signal that the stock is likely to benefit from favorable broader factors in the immediate future. Add to this robust value metrics, and we believe that we have a strong value contender in Enova International.
Just Released: Zacks’ 7 Best Stocks for Today
Experts extracted 7 stocks from the list of 220 Zacks Rank #1 Strong Buys that has beaten the market more than 2X over with a stunning average gain of +24.5% per year.
These 7 were selected because of their superior potential for immediate breakout.
See these time-sensitive tickers now >>
Enova International, Inc. (ENVA): Free Stock Analysis Report
Original post
Zacks Investment Research