• PBoC: There is no basis for further yuan depreciation China’s central bank said that there is no basis for further depreciation in the yuan and that they will try to keep the currency at a stable, equilibrium level as the currency weakened for a third day after Tuesday’s unexpected devaluation. The country’s strong economic environment, sustained trade surplus and deep foreign exchange reserves provide “strong support” to the exchange rate. The Bank intervened to ease the declines and control the pace of depreciation to limit capital outflows, therefore yuan opened only slightly weaker on Thursday. Chinese state-owned banks seems to have sold dollars to support yuan from falling sharply, and also put limit on some firms’ purchases of USD. This explains the weakness seen in the greenback in the last few days.
• Under a new methodology used to determine the fixing, market makers who submit contributing prices have to consider the previous day’s close, foreign-exchange demand and supply, as well as changes in major currency rates. The reform serves the long-term goal of building a more flexible and market-based exchange rate formation system. Nevertheless, the intervention risk remains high so we will be watching closely the yuan deviations, as it can diverge maximum 2% from its daily fixing before PBoC intervenes.
• The main gainer from China’s devaluation was euro, amid speculation that investors unwind trades that used the single currency to buy yuan. In addition, the concern that China’s policy will discourage Fed from raising interest rates this year also caused some weakness in the dollar, which was lower against all of its major peers. But following the New York Fed President William Dudley's comments, one of the most dovish members of the Committee, that the Fed is approaching the moment when it can start raising interest rates, USD could regain its lost glamour.
• Today’s highlights: During the European day, the final German CPI data for July confirmed the preliminary reading and rose 0.1% yoy, in line with expectations. The reaction in the market was minimal.
• Sweden’s CPI and CPIF for July are also due to be released. Following the dip of the CPI back to deflation in June, another sign of weakness in prices could prompt the Bank to ease further its monetary policy. The Bank held out several times the possibility to act even between the ordinary monetary policy meetings, should the need arise. As such, any sign of softness in prices is likely to keep SEK under pressure.
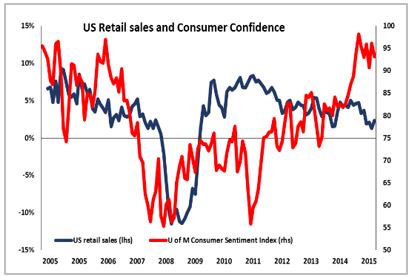
• In the US, the highlight will be the retail sales for July. Retail sales unexpectedly declined in June and the May increase was revised down. This frustrated investors who have being looking for signs that the soft Q1 data was coming to an end. Nevertheless, given the strong 1st estimate of the US GDP for Q2 and expectations for a rebound in July’s retail sales, we would expect USD bulls to gain confidence again and strengthen the greenback on the news. Initial jobless claims for the week ended Aug. 8 are also coming out.
The Market
EUR/USD surges and slightly above 1.1200
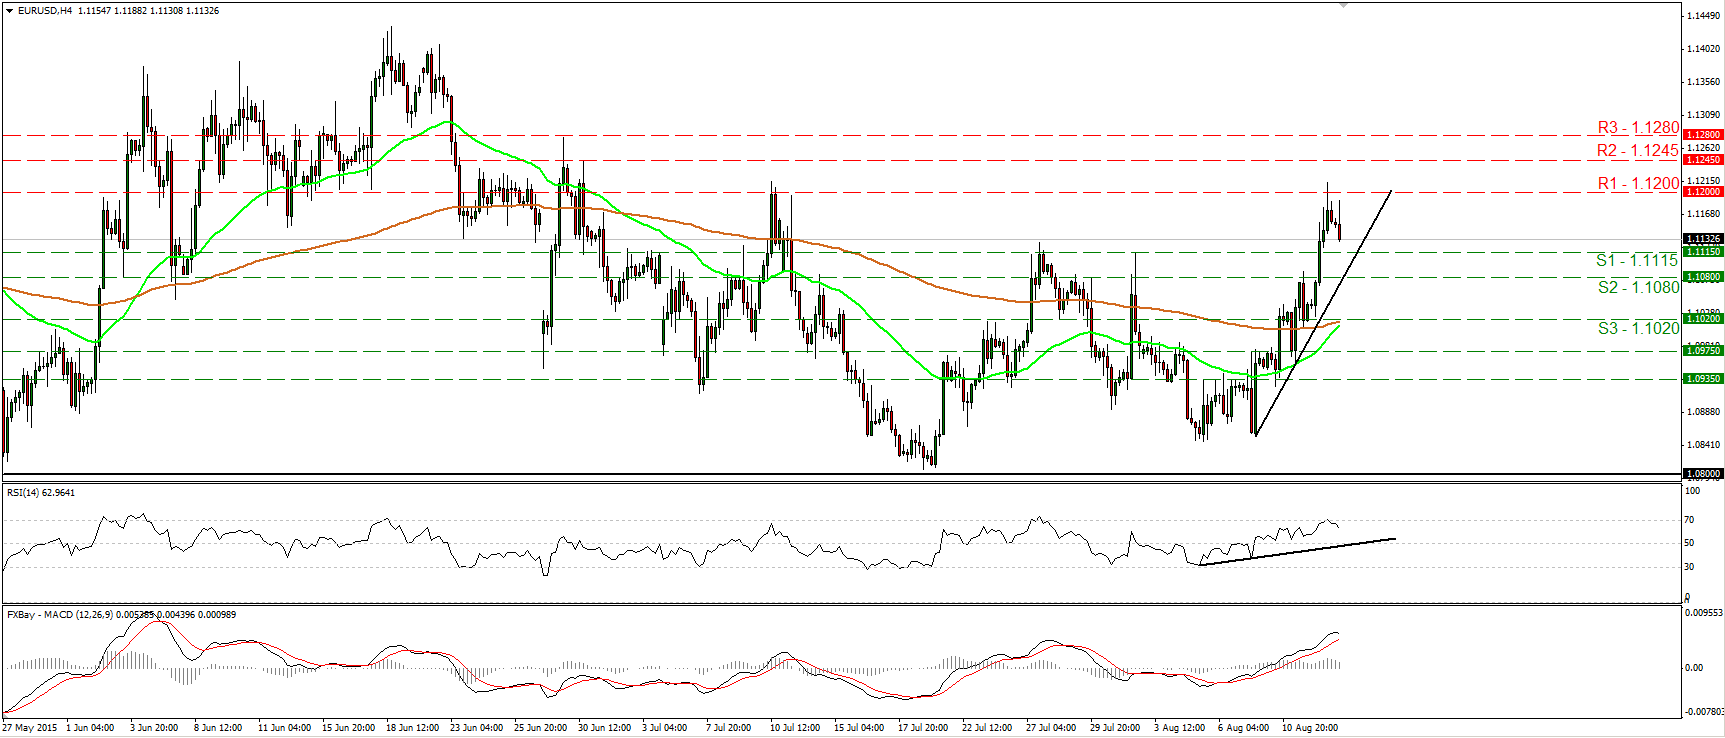
• EUR/USD surged on Wednesday, broke above both prior resistance-turned-into-support of 1.1080 (S2) and 1.1115 (S1), and hit resistance slightly above the key barrier of 1.1200 (R1). Subsequently, the rate retreated. Since the rate is trading above the uptrend line taken from the low of the 7th of August, I would consider the short-term outlook to remain positive. A move above 1.1200 (R1) could probably open the way for the next resistance at 1.1245 (R2). However, taking a look at our short-term oscillators, I see signs that further retreat could be on the cards before the next positive leg, perhaps to test the 1.1115 (S1) line as a support this time. The RSI hit resistance at its 70 line and turned down, while the MACD shows signs of topping and that it could fall below its trigger line soon. As for the broader trend, as long as EUR/USD is trading between 1.0800 and 1.1500, I would consider the longer-term picture to stay flat. I believe that a move above the psychological zone of 1.1500 is the move that could carry larger bullish implications, while a break below 1.0800 is needed to confirm a forthcoming lower low on the daily chart and perhaps turn the overall bias back to the downside.
• Support: 1.1115 (S1), 1.1080 (S2), 1.1020 (S3)
• Resistance: 1.1200 (R1), 1.1245 (R2), 1.1280 (R3)
EUR/GBP hits the 0.7160 obstacle
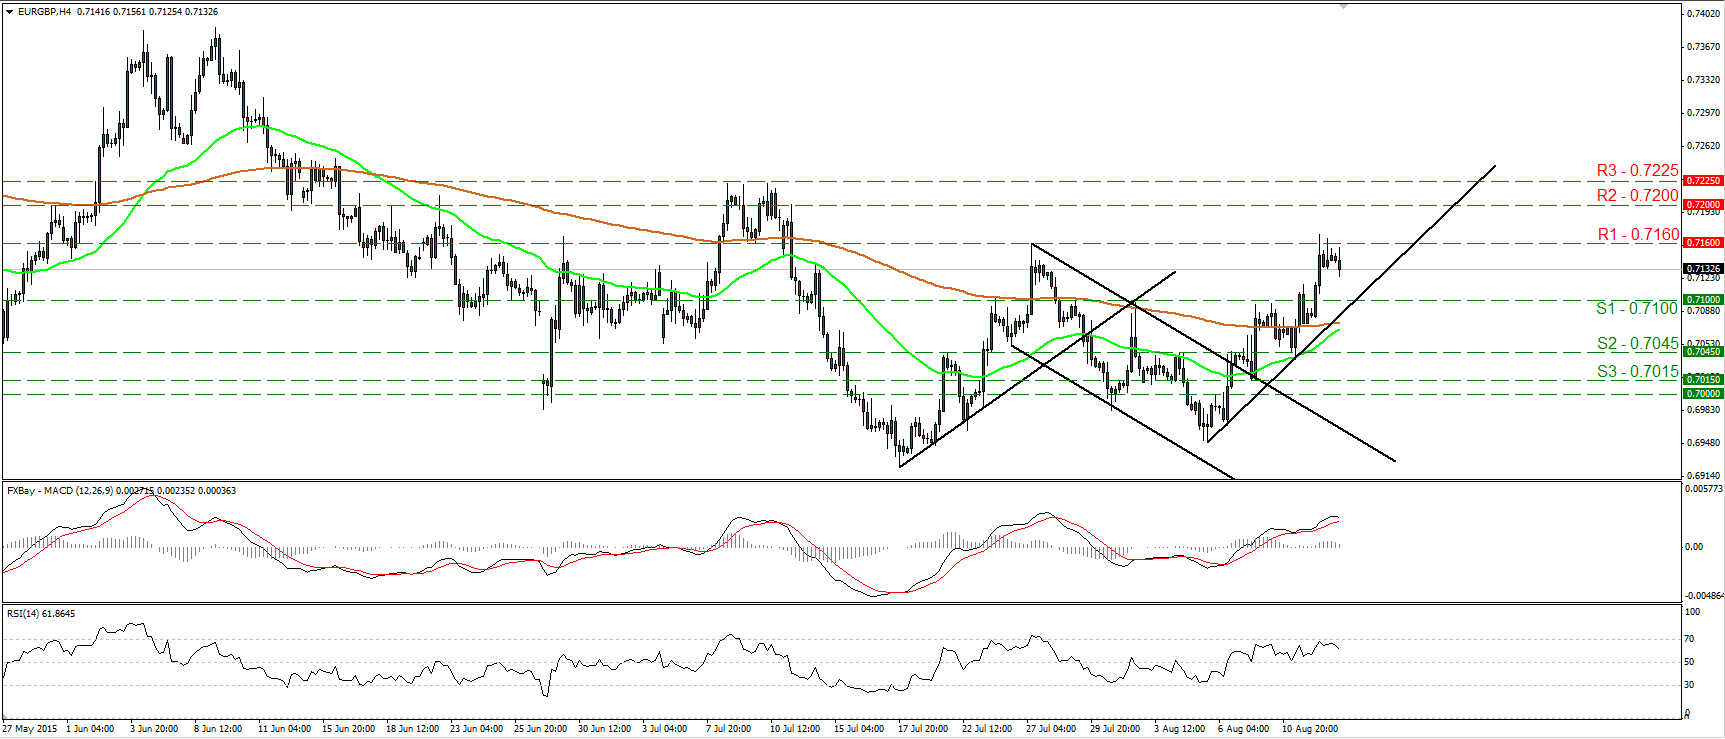
• EUR/GBP surged on Wednesday, broke above the resistance (now turned into support) of 0.7100 (S1), and hit resistance slightly above the 0.7160 (R1) line. Then the rate retreated somewhat. Since EUR/GBP is still trading above the uptrend line taken from the low of the 5th of August, I would consider the short-term trend to be positive. Another attempt above 0.7160 (R1) could open the way for the next resistance at 0.7200 (R2). Taking a look out our oscillators though, I see signs that further pullback could be looming before the bulls take in charge again. The RSI hit resistance at its 70 line and turned down, while the MACD has topped and could fall below its trigger line. On the daily chart, the fact that on the 5th of August the rate formed a higher low make me keep a neutral stance as far as the overall picture is concerned. A clear daily close above 0.7160 (R1) could signal the completion of a failure swing bottom and perhaps carry larger bullish implications.
• Support: 0.7100 (S1), 0.7045 (S2), 0.7015 (S3)
• Resistance: 0.7160 (R1), 0.7200 (R2), 0.7225 (R3)
NZD/USD doesn’t hold below 0.6500
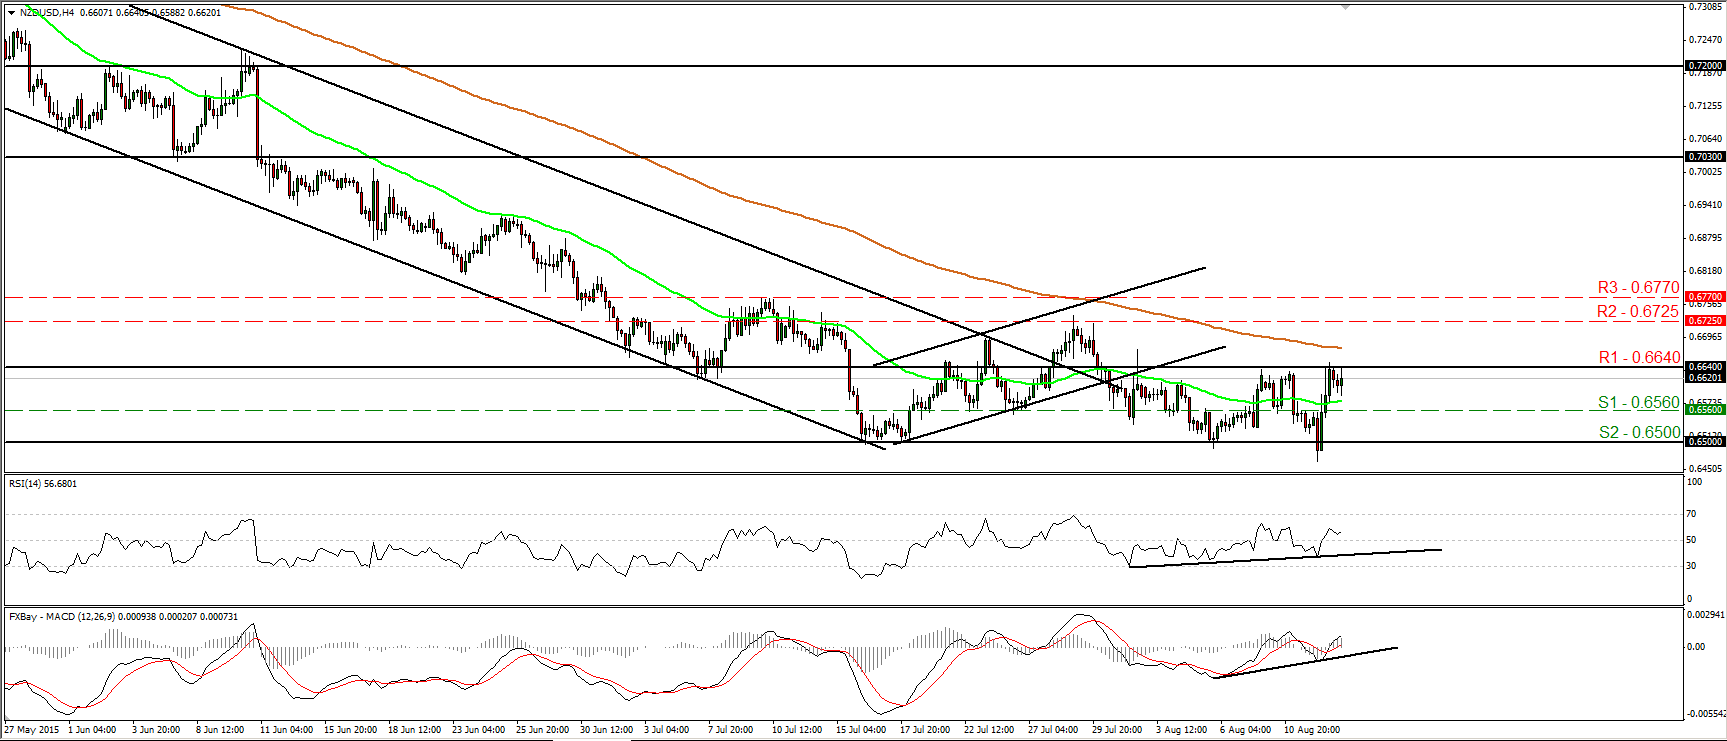
• NZD/USD raced higher after it dipped below the psychological zone of 0.6500 (S2) for a while, and hit resistance near 0.6640 (R1). The pair has been oscillating between these two zones since the 30th of July, and hence I see a sideways short-term path. Nevertheless, looking at our momentum studies, there is the likelihood for the pair to trade higher. The RSI, already above 50, has turned up again, while the MACD stands above both its zero and signal lines. Moreover, there is positive divergence between both the indicators and the price action. A break above 0.6640 (R1) could confirm the case and perhaps open the way for the 0.6725 (R2) area. On the daily chart, I still see a longer-term downtrend. So, in the absence of any major bullish trend reversal signals, I would treat any further short-term advances as a corrective phase of that longer-term downtrend.
• Support: 0.6560 (S1), 0.6500 (S2), 0.6435 (S3)
• Resistance: 0.6640 (R1), 0.6725 (R2), 0.6770 (R3)
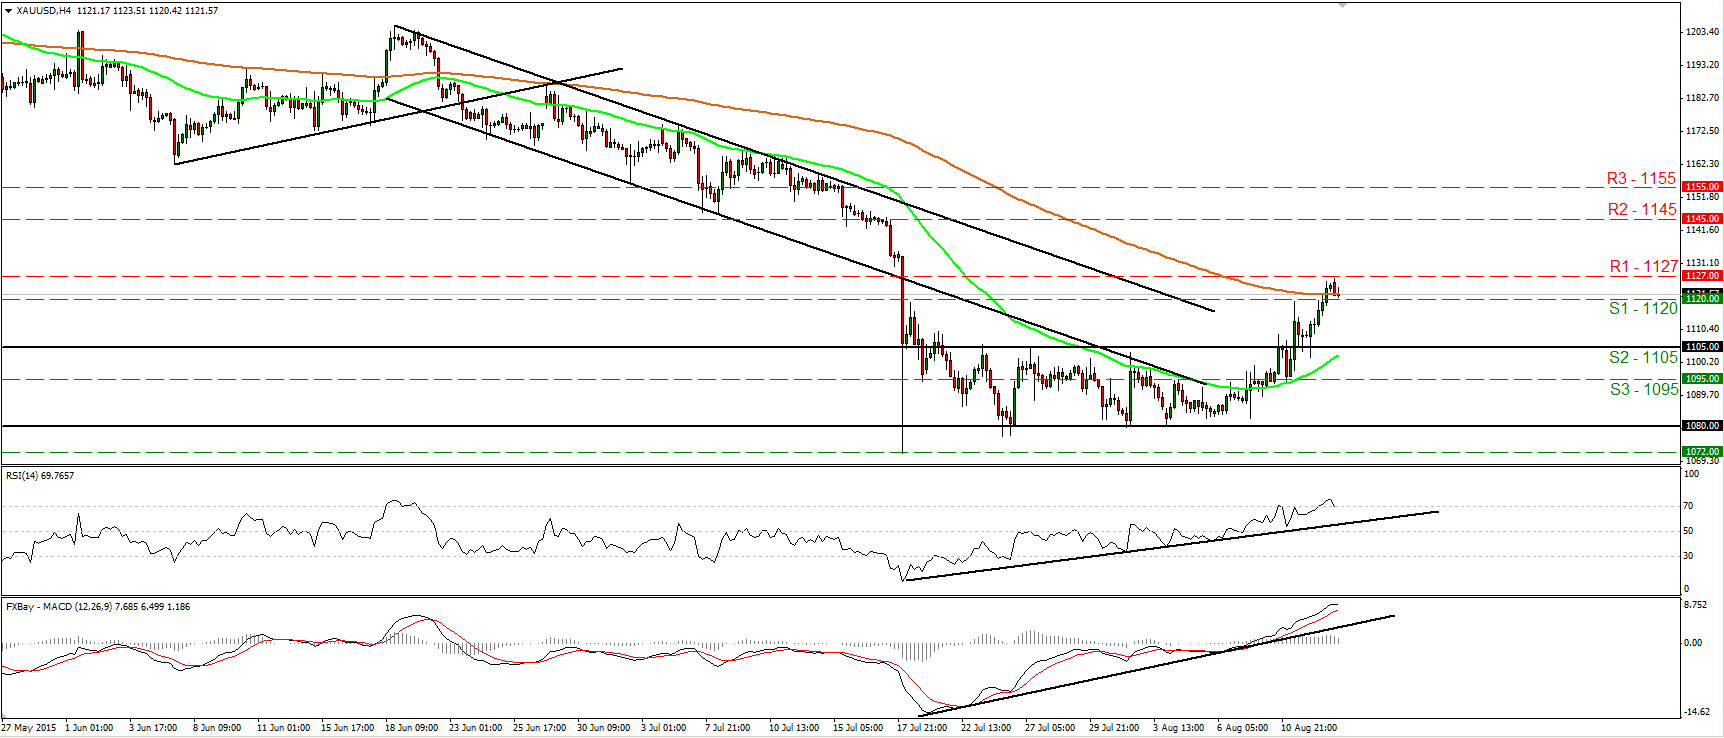
Gold breaks above 1120
• Gold continued trading higher on Wednesday, breaking above the resistance-turned-into-support of 1120 (S1). The advance was halted at 1127 (R1), pulled back a bit and is now testing the 1120 (S1) zone as a support. I still believe that, since the rate have broken above the upper bound of the sideways range it’s been trading from the 21st of July until the 11th of August, the short-term outlook is positive. Nevertheless, taking into account the signs given by our momentum indicators, I would expect further setback. The RSI has topped within its overbought territory and looks ready to fall below 70 soon, while the MACD shows signs of topping and that it could fall below its trigger line soon. In the bigger picture, the plunge on the 20th of July triggered the continuation of the longer-term downtrend and this keeps the overall bias of the yellow metal to the downside, in my view. As a result, I would treat the short-term uptrend as a corrective move of the longer-term downtrend.
• Support: 1120 (S1), 1105 (S2), 1095 (S3)
• Resistance: 1127 (R1), 1145 (R2), 1155 (R3)
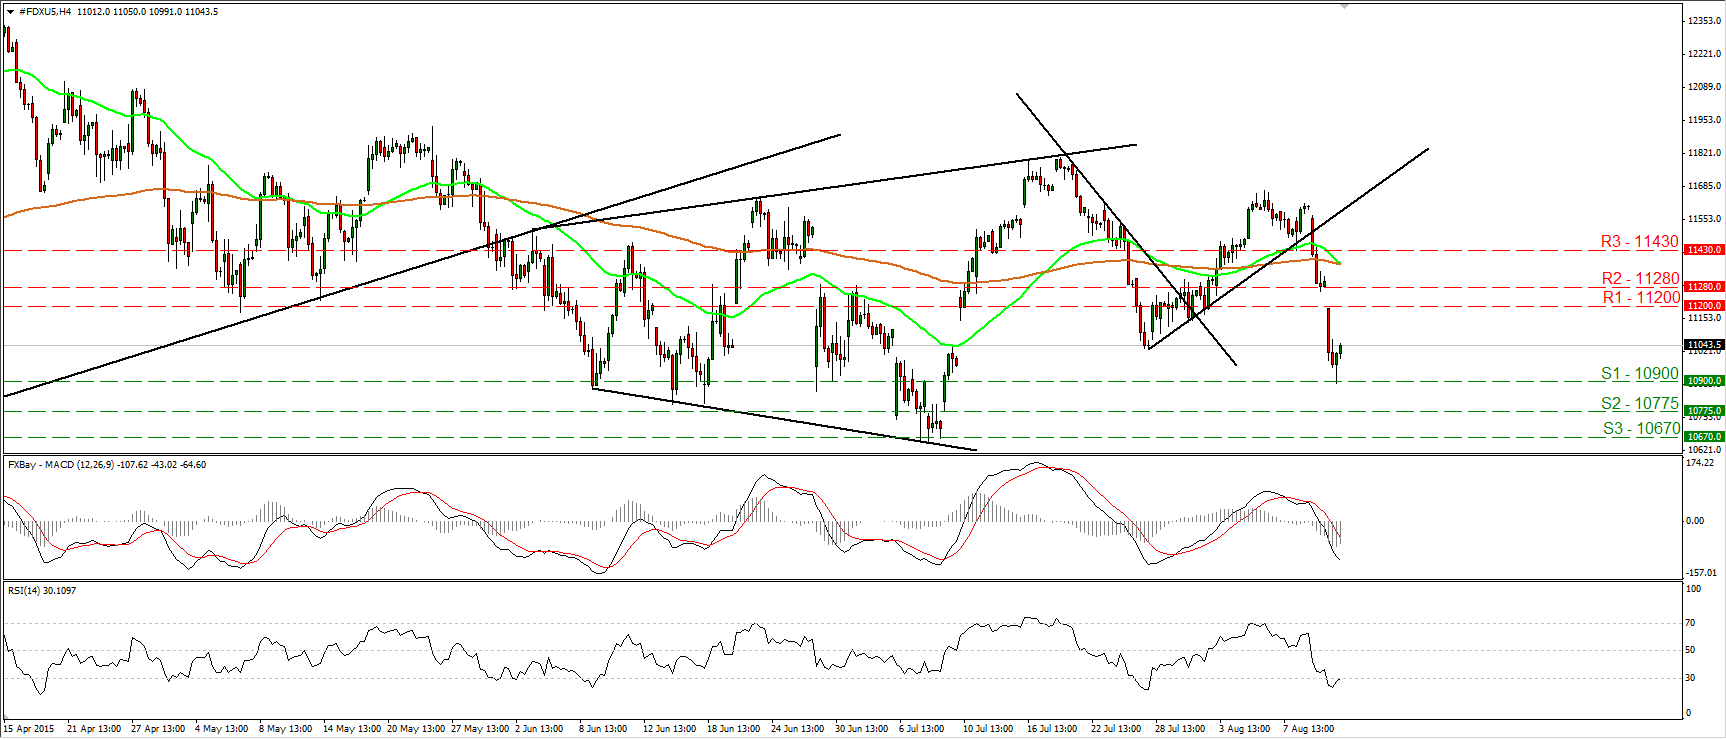
DAX futures collapse and hit support at 10900
• DAX futures collapsed, falling below the short-term uptrend line taken from the low of the 27th of July and hitting support at 10900 (S1). I believe that the near-term bias has now turned negative, but having a look at our momentum indicators, I would expect the forthcoming wave to be positive. Perhaps for a test at the resistance hurdle of 11200 (R1). The RSI has bottomed within its oversold territory and looks able to move above 30 soon, while the MACD, although below both its zero and signal lines, shows signs that it could start bottoming. As for the broader trend, I will maintain my flat stance. I prefer to see a clear close above 11800 before I assume the continuation of the prevailing major upside path, while a break below 10670 (S3) is the move that could bring a bearish trend reversal, in my view.
• Support: 10900 (S1), 10775 (S2), 10670 (S3)
• Resistance: 11200 (R1) 11280 (R2), 11430 (R3)

