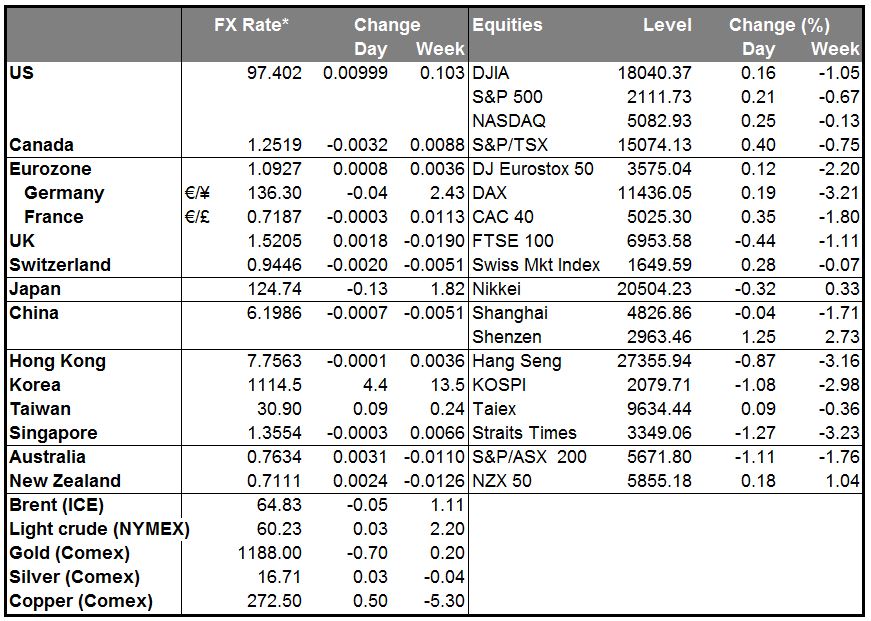
Fed tightening is back on the schedule; should support USD The dollar weakened Monday afternoon after German inflation accelerated and US personal consumption disappointed, even though personal income beat expectations. The figures suggest that people are saving any extra money they get, not spending it, which may be good for their balance sheets but isn’t going to help a consumption-driven economy. Is this change in behaviour cyclical or structural? Is it due to demographic changes (an aging population) or job insecurity? The personal consumption expenditure (PCE) deflator, the Fed’s favorite inflation gauge, also was softer than expected.
However later in the day, both the Markit (NASDAQ:MRKT) and ISM manufacturing PMIs beat expectations, and that turned sentiment around. Fed fund rate expectations for end-2017, for example, finished the day 9 bps higher, even after being down slightly at the start of the session. As a result, the dollar gained against almost all the currencies we follow. EUR/USD moved back below 1.0900 and USD/JPY broke to new highs for this cycle.
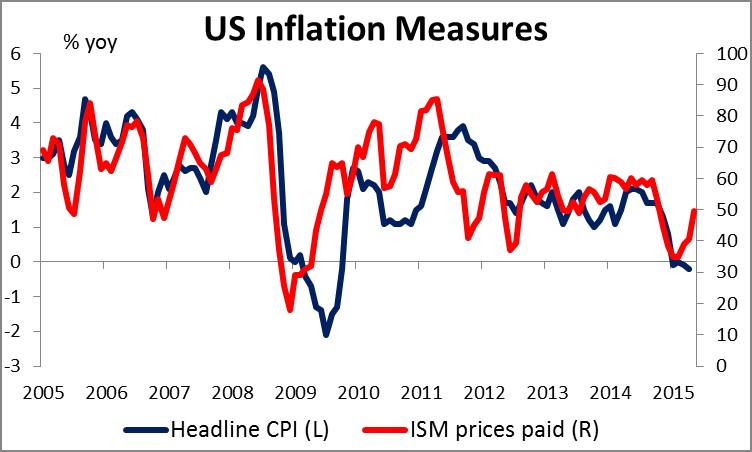
While the PCE was indeed below expectations, most of the negative surprise came from one component, inflation of financial services and insurance. Except for that, the other components showed steady growth. Moreover, the ISM prices paid index rose to 49.5 from 40.5, beating expectations and suggesting that wholesale prices are not declining so fast any more. The inflation news was therefore not as bad as it looks, and probably won’t discourage the Fed from hiking rates (as the Fed funds futures imply). That idea is likely to continue to support the dollar today.
Greece: lots of rumors, little substance Markets were affected late Tuesday in Europe by a report on Twitter (NYSE:TWTR) that a deal on Greece would be announced. However, it was quickly denied. In fact it was highly improbable, coming just hours after reports that there had been no progress over the weekend. More likely, there would be several days of stories in the press reporting gradual progress on some of the issues, including more positive comments from European sources, who generally remain pessimistic about the possibility of a successful conclusion. There might be a report of some “take it or leave it” final offer from the institutions.
There was a top-level meeting on Greece late last night with Chancellor Merkel, IMF chief Lagarde, ECB President Draghi, French President Hollande and EC President Juncker. The five met in person yesterday in Berlin to hammer out an offer for Greece. However, the statement following the meeting said nothing of substance, just that work must continue “with greater intensity” – so what have they been doing up to now, playing mah jong? -- which makes me doubt that they had anything new to offer. If they don’t, then it still comes down to when the Greek government will give in to the institutions’ demands. Watch to see whether any further details about this meeting leak out today, in particular whether they had anything new to offer Greece. If not, then the stalemate continues. Without a resolution today, it will be very difficult for Greece to make the payment on Friday (unless of course it decides to wrap all of its June payments into one, which is technically possible although they have so far rejected that idea).
And even if they do reach an agreement, remember that they are currently negotiating only on the release of the final tranche of the existing bailout. They haven’t even started talking about the third bailout yet. Those discussions would probably be even more difficult, which is to say, virtually impossible. However, the relatively narrow spreads over Bunds on peripheral Eurozone debt suggest that investors are not particularly concerned about these matters. They should be. So should holders of EUR.
RBA stays on hold; no bias The Reserve Bank of Australia (RBA) met today and kept its cash rate unchanged. That was expected. What the market was looking for was whether they would reinstitute an easing bias (as I thought). In the event, the Bank did not stipulate a bias one way or the other. They just said that the data in the future will tell them whether their stance is appropriate – in other words, they have a basically neutral stance that could go either way. They did say that “monetary policy needs to be accommodative,” but of course that just describes their policy as it currently is, not how it will develop. About the currency, they repeated last month’s statement that “further depreciation seems both likely and necessary…” with no change. However, AUD/USD jumped about 30 pips on the news. The market is currently pricing in one more rate cut this year, but the neutral stance suggests there is the possibility of no rate cut, which explains the bounce in AUD. Personally, I expect the Chinese economy to slow and for that to dampen growth in Australia further, leading to at least one more rate cut and a weaker AUD.
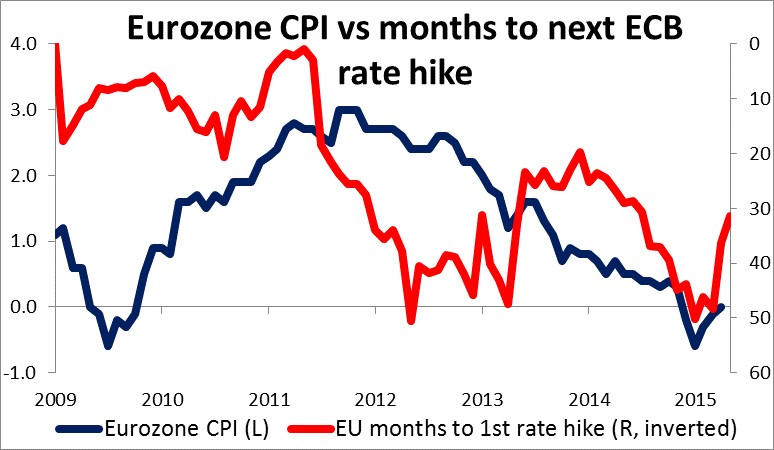
Today’s highlights: During the European day, Eurozone’s flash CPI for May is coming out. The rise of the German inflation rate on Monday helped to dampen deflation fears in the region somewhat. A better-than-expected Eurozone figure could help to stabilize inflation expectations, which is good news for the ECB. Although it is clearly a sign that the QE program by the ECB is starting to have some positive impact, it will take time for all the measures to be enacted and take full effect. The market is currently expecting that the ECB won’t start hiking rates until Dec. 2017, more than a year after the earliest the QE program might end. In that respect, whether inflation is up a bit won’t make a whole lot of difference to expectations for near-term monetary policy and therefore for the euro. German unemployment rate for May is also coming out.
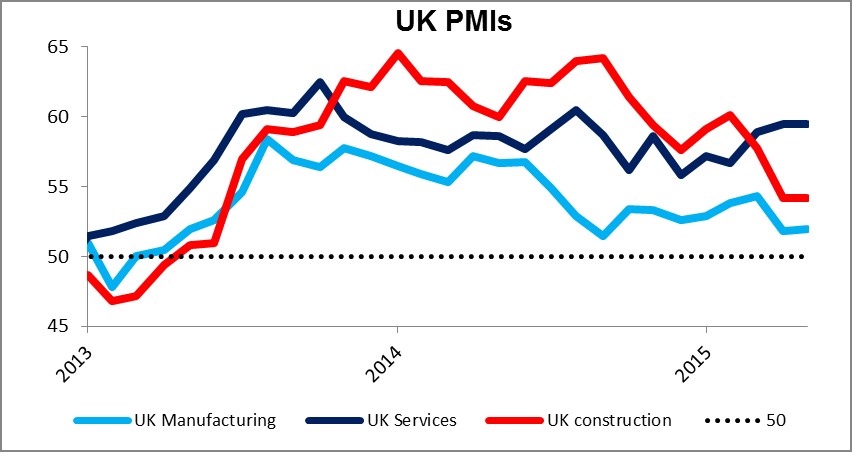
In the UK, we get the construction PMI for May, which is forecast to have increased to 55.0 from 54.2. On Monday, the country’s manufacturing PMI missed expectations and raised concerns over the expected rebound in Q2. Another soft figure could give additional evidence of a moderate expansion in Q2, and put GBP under selling pressure. Mortgage approvals for April are also due to be released.
In the US, factory orders for April are expected to fall, a turnaround from the previous month.
As for the speakers, Fed Governor Lael Brainard speaks.
The Market
EUR/USD in a sideways mode
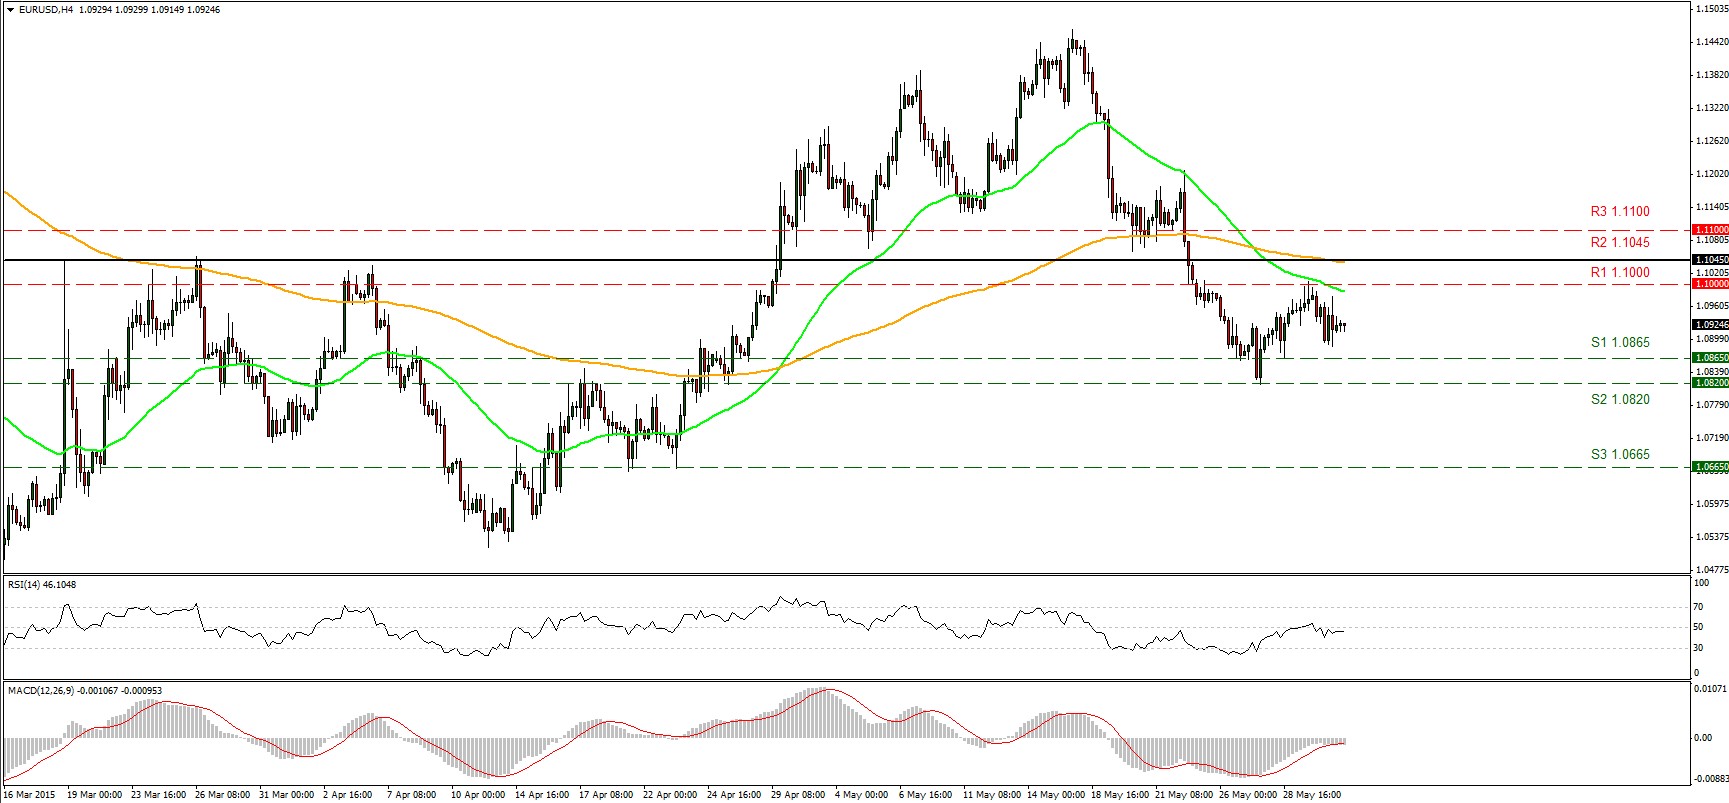
EUR/USD remained locked in a consolidation mode on Monday, within a range of 1.1000 (R1) and 1.0865 (S1). As the European trading session Tuesday gets under way, I would expect the bears to push the rate lower, at least for another test of our 1.0865 (S1) support level. A clear break of that level could push the rate even lower, perhaps towards our next support of 1.0800 (S2). If the pair falls below that level, this could confirm a forthcoming lower low on the 4-hour chart and perhaps pave the way for the 1.0665 (S3) zone. In the case of an upside move, it could stay limited below the 1.1045 (R2) zone. In the bigger picture, the move below the 1.1045 (R2) barrier increases the likelihood that the 13th of April – 15th of May recovery was just a corrective move and that the prior downtrend could now be resuming.
• Support: 1.0865 (S1), 1.0820 (S2), 1.0665 (S3).
• Resistance: 1.1000 (R1), 1.1045 (R2), 1.1100 (R3).
GBP/USD near the 1.5160 support level
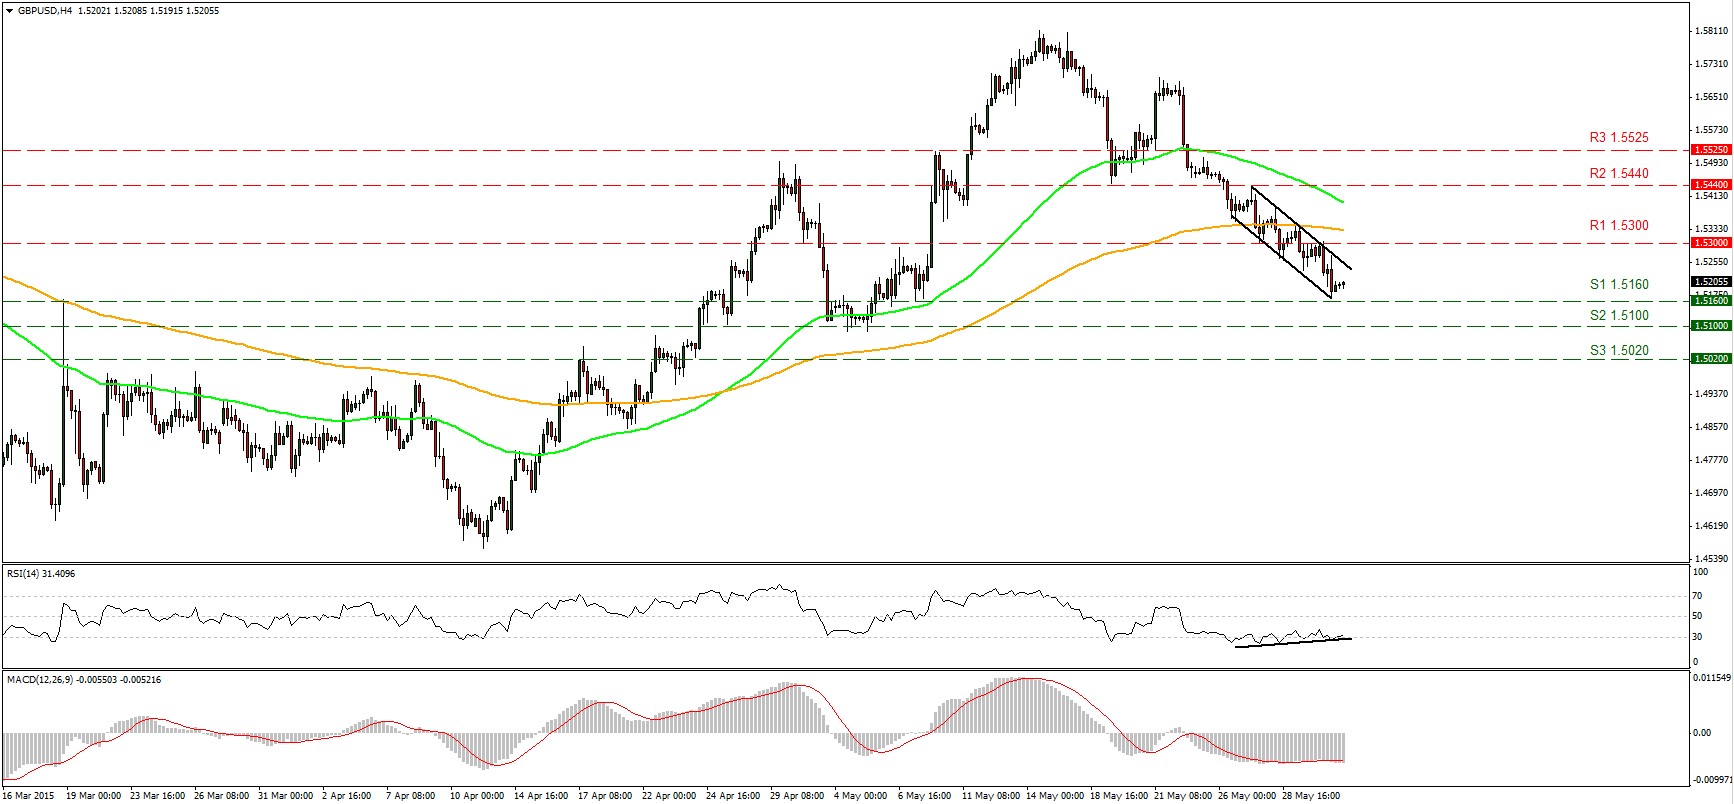
GBP/USD declined on Monday to find support around our 1.5160 (S1) zone and the lower boundary of the downside channel. The short-term outlook is still somewhat negative, but a break of the 1.5160 (S1) support line is needed for further declines. Following the weak manufacturing PMI on Monday, a soft construction PMI today could be the trigger for the decline. Nevertheless, I still see a positive divergence between the price action and our momentum signs, which make me watchful for possible bounce at least until the upper boundary of the channel. On the daily chart, the rate fell below the 80-day exponential moving average, which turned the broader picture negative again.
• Support: 1.5160 (S1), 1.5100 (S2), 1.5020 (S3) .
• Resistance: 1.5300 (R1), 1.5440 (R2), 1.5525 (R3).
USD/JPY touched 125.00
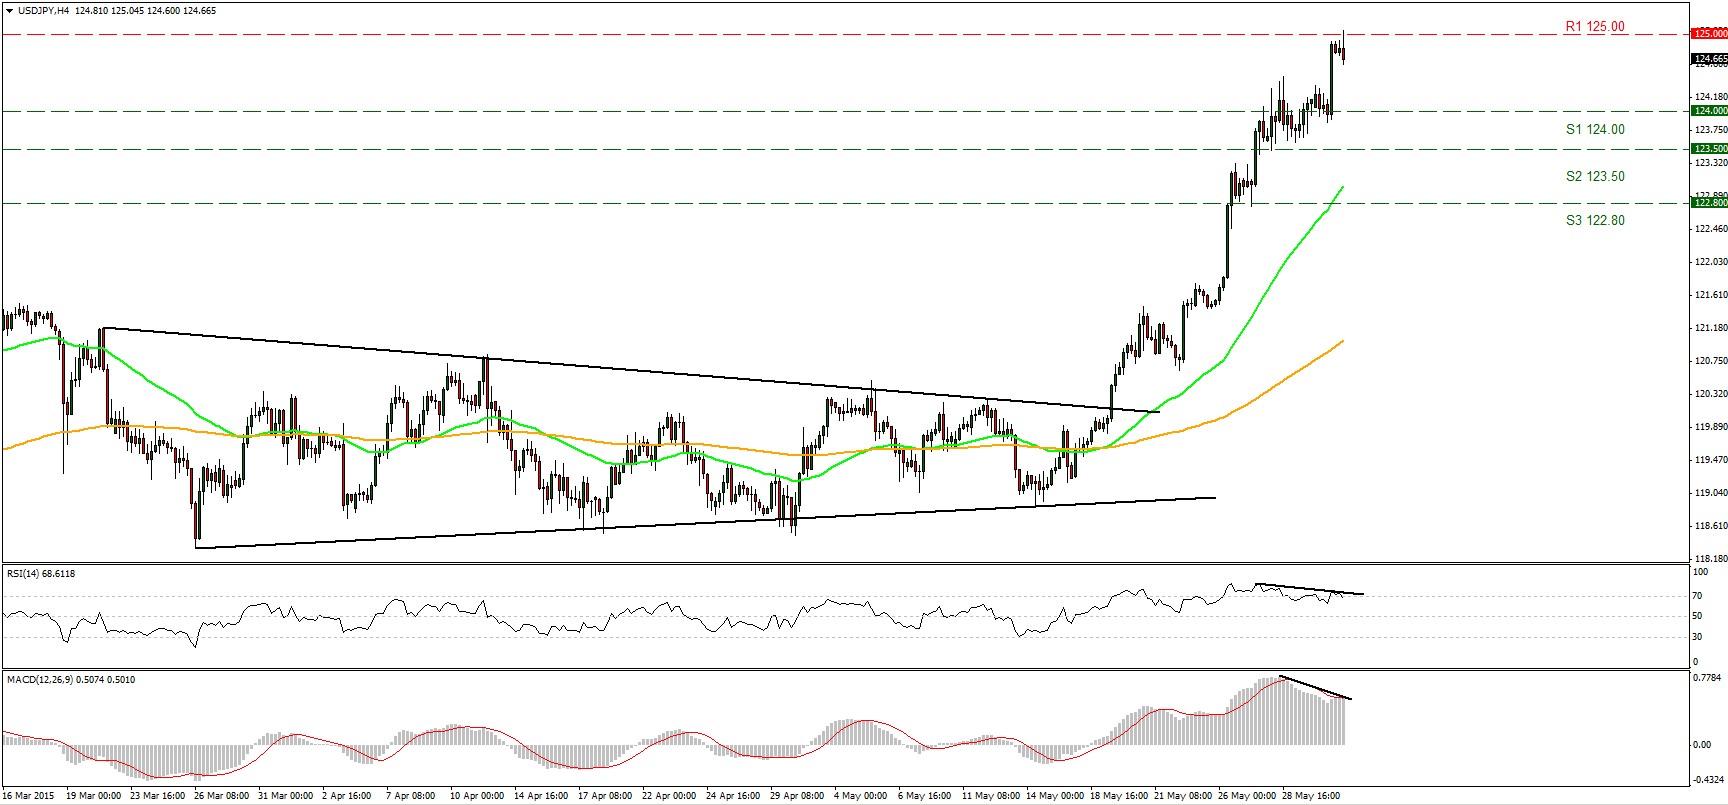
USD/JPY surged on Monday after finding support near the 124.00 (S1) level to touch the key psychological barrier of 125.00 (R1). During the early European morning Tuesday, the pair is trading near that hurdle, and a break of it could push the rate higher towards our next resistance of 125.80 (R2). Even though the short-term picture remains positive, we could see a minor pullback before the next leg higher. There is still negative divergence between our short-term momentum indicators and the price action that support the next move lower. The RSI just below its 70 territory points down, while the MACD failed to cross above its trigger line turned down again. On the daily chart, the break above 122.00 confirmed a forthcoming higher high on the daily chart and signaled the continuation of the longer-term bullish trend.
• Support: 124.00 (S1), 123.50 (S2), 122.80 (S3).
• Resistance: 125.00 (R1), 125.80 (R2), 126.60 (R3).
Gold near the upper boundary of the downside channel
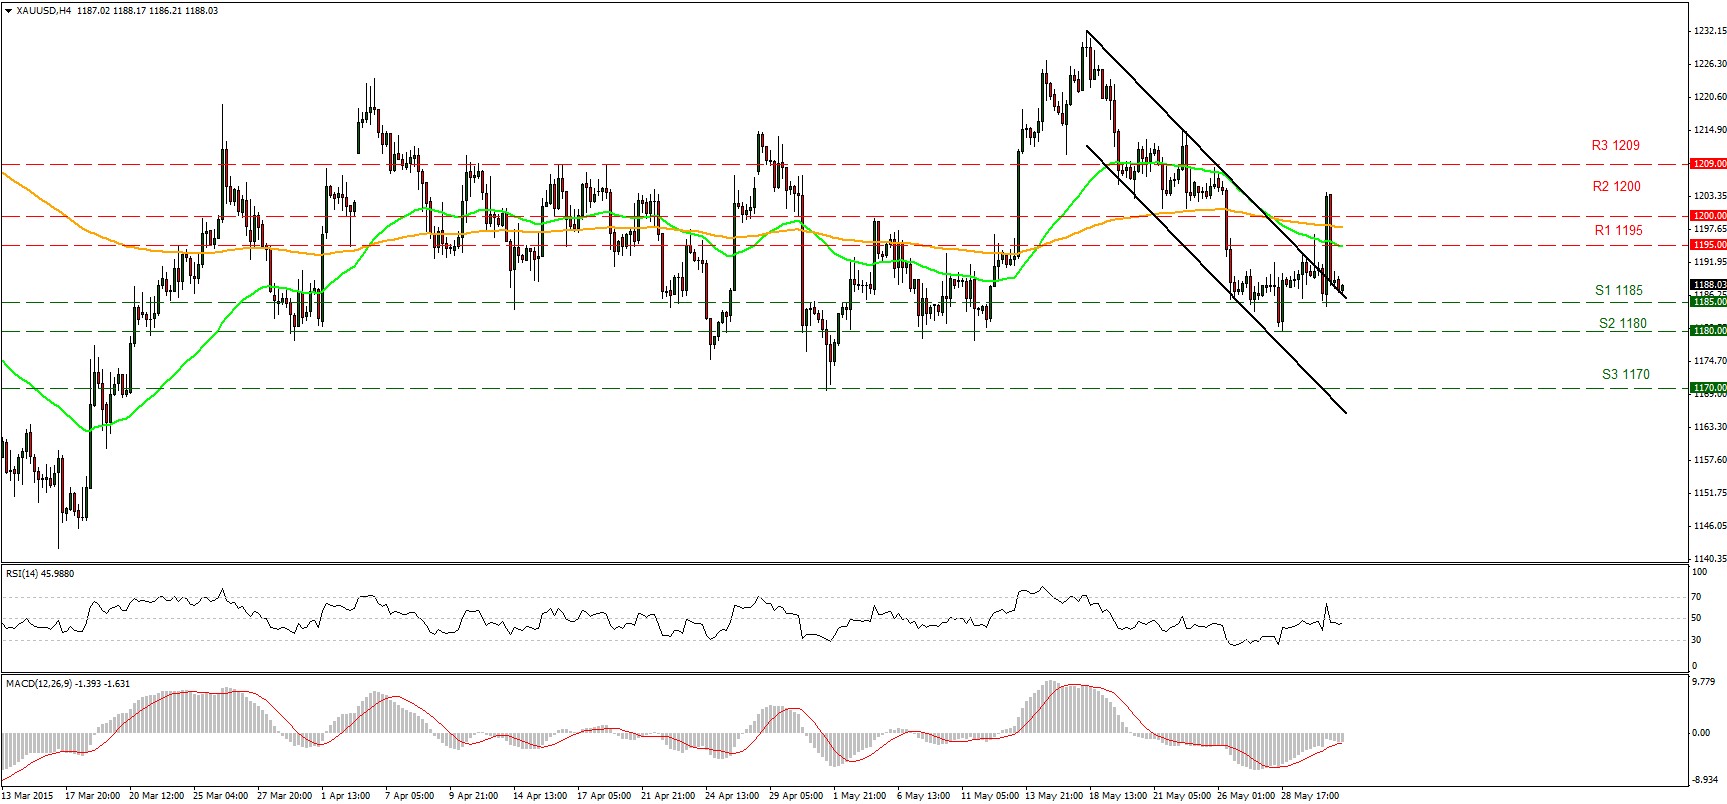
Gold surged on Monday, breaking above the upper boundary of the black downside channel and two resistance lines in a row, but gave back most of the gains immediately to trade only somewhat higher. The upper boundary of the channel turned into support line and during the early European Tuesday, the precious metal declined towards our 1185 (S1) support line. A break of that line could push the price lower, perhaps for a test of our next support at 1180 (S2). Our short-term momentum signals support a decline, as the RSI stands just below its 50 line pointing down, while the MACD, already in its negative territory, seems ready to cross its trigger line. In the bigger picture, gold has been trading in a non-trending mode since the last days of March. Therefore, although I see a negative near-term picture, I would maintain my neutral stance as far as the overall picture is concerned.
• Support: 1185 (S1), 1180 (S2), 1170 (S3).
• Resistance: 1195 (R1), 1200 (R2), 1209 (R3).
WTI just above 60
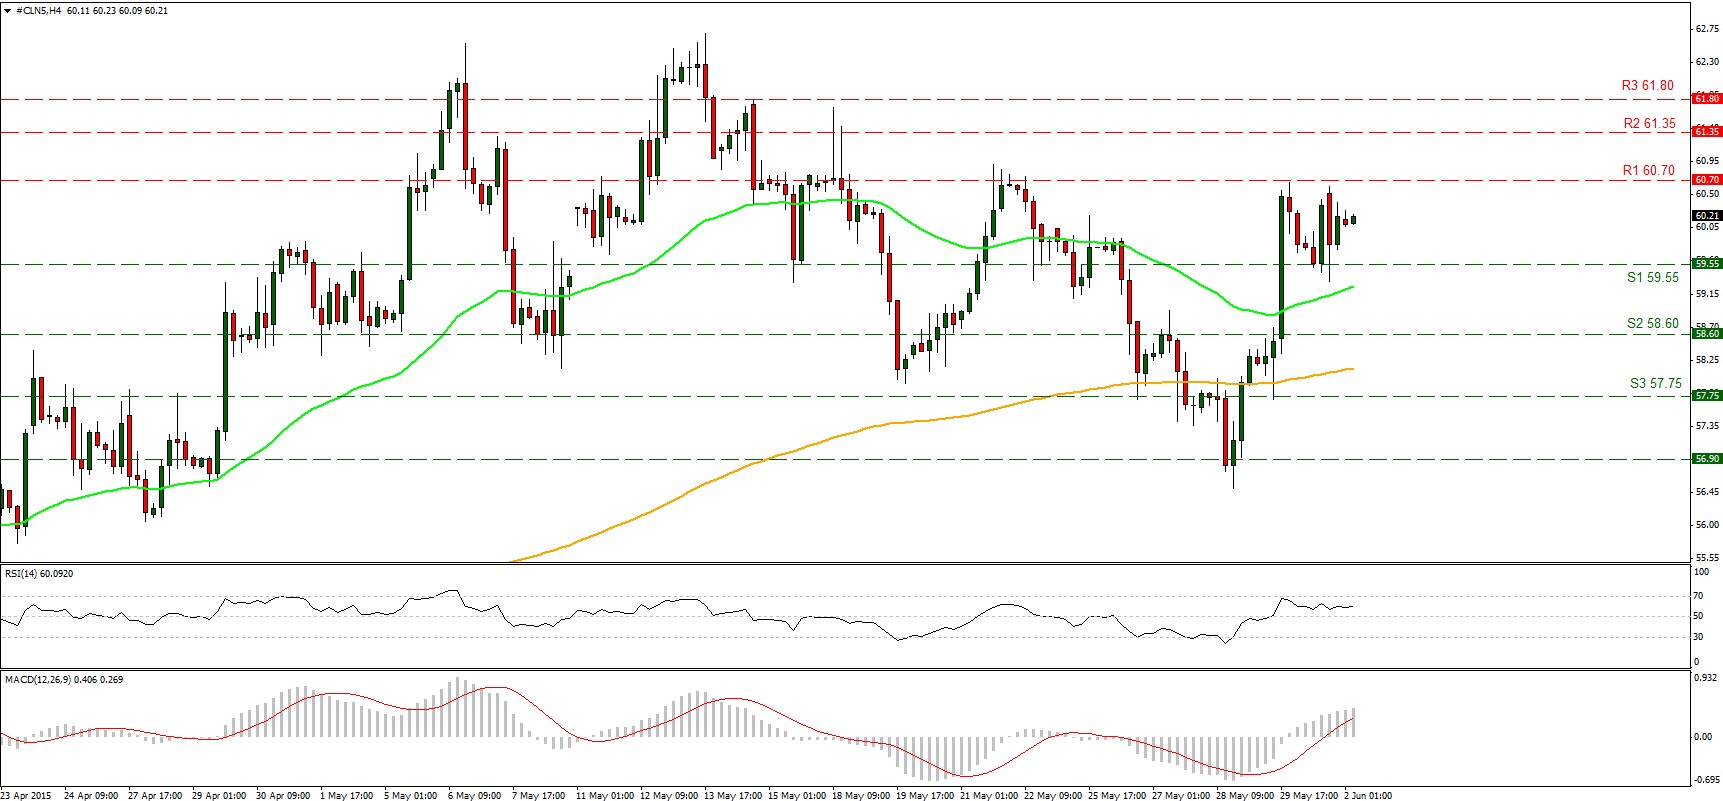
WTI surged on Monday, but found resistance near 60.70 (R1) again on Friday, and fell to trade few cents above the 59.55 (S1) support zone. Given the inability of the bulls to push the price above that hurdle, I would expect the next move to be a decline, perhaps for a test of our 59.55 (S1) support line. A break of that line could push the price even lower, perhaps towards our next support of 58.60 (S2). As for the broader trend, the break above 55.00 on the 14th of April signaled the completion of a double bottom formation, something that could carry larger bullish implications in the not-too-distant future. Therefore, I would treat any declines that stay limited above 55.00 as a corrective phase for now.
• Support: 59.55 (S1), 58.60 (S2), 57.75 (S3).
• Resistance: 60.70 (R1) 61.35 (R2), 61.80 (R3) .


