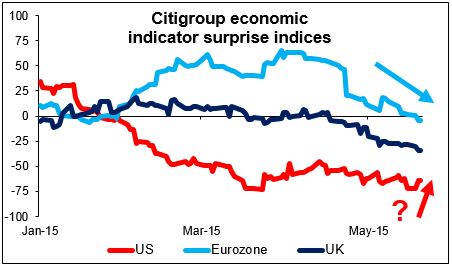
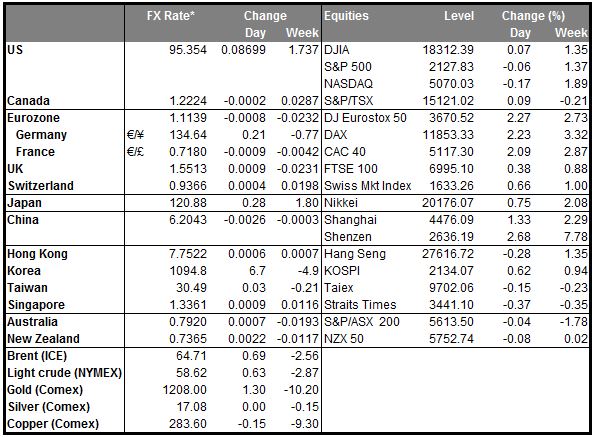
• Dollar continues to gain: the dollar continued to gain ahead of today’s FOMC minutes (see below). Yesterday’s better-than-expected US building permits and housing starts for April adds to a few other better-than-expected data points recently to suggest that perhaps the US economy was just held down during Q1 by the bad weather and the port strike. Fed funds rate expectations rose as much as 6 bps yesterday and the day before. Meanwhile, European data has been surprising less and less on the upside, giving less and less upward impetus to the euro. Plus comments by ECB Board member Benoit Coeure that the ECB is likely to speed up its bond purchases ahead of the summer pushed Bund yields down and widened the advantage of US bonds over European bonds. Sentiment for the USD now seems to be turning around – again.
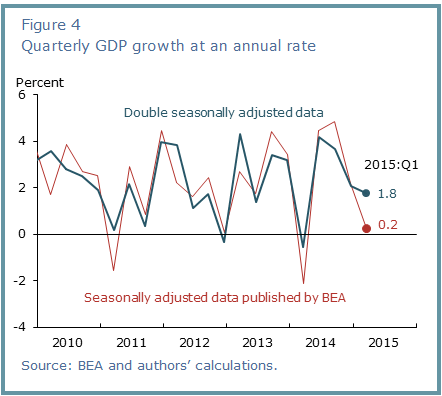
• Distortions in Q1: The market talk recently is about the distortions in the economy that caused the slow growth. The Wall Street Journal carried a widely quoted story noting that March was perhaps the worst month since the 2008/09 financial crisis, but attributing it to the resolution of the West Coast port strike, which caused a surge of imports and therefore a sharp drop in net exports. Subsequently, the San Francisco Fed published a study saying that issues with seasonal adjustment are depressing GDP data for Q1. They applied a “second round of seasonal adjustment.” “After this correction, aggregate output grew much faster in the first quarter than reported,” they concluded. According to their calculations, the economy grew by 1.8% qoq SAAR in Q1, rather than the initial estimate of 0.2%. (Their paper is available on the web at http://www.frbsf.org/economic-research/publications/economic-letter/2015... )
Of course, this study contradicts another one published four days earlier by the Fed’s Board of Governors, which said it “does not find convincing evidence” of any problems with the seasonal adjustment (http://www.federalreserve.gov/econresdata/notes/feds-notes/2015/residual... ). Nonetheless, the fact that this debate is heating up gives ammunition to those who are looking for last year’s pattern to repeat itself and therefore supports those on the FOMC who are looking for any excuse to hike rates. It is therefore USD-bullish. The revised figure for 1Q GDP is due out on May 29th.
• Meanwhile, the Atlanta Fed’s “GDPNow” estimate of Q2 US GDP is 0.7% qoq SAAR, far below the market consensus of +2.7%. But that won’t be released until July 30th, by which time the debate will have moved on.
• Greek deal by end-May? German Chancellor Merkel and French President Hollande yesterday said talks with Greece must be accelerated to produce an agreement by the end of May because of the country’s financial needs. EC President Juncker said he expected a deal by late May or early June. However, a threat has appeared from a different source: as many as 100 of Merkel’s 311 Christian Democratic party members of the German lower house (Bundestag) are apparently objecting to further aid for Greece. The Bundestag would have to approve any substantial changes to the conditions for Greece’s aid program. A deal for Greece would remove a big risk factor from the euro and be EUR-positive. Failure, on the other hand, could be disastrous.
• Japanese growth exceeds estimates: Japan’s GDP grew by 2.4% qoq SAAR in Q1, rising from Q4’s 1.5% pace and beating estimates of 1.6%. It wasn’t just because of deflation, either; nominal growth also rose briskly. Capital investment rose for the first time in four quarters while inventories also rose, showing that companies are getting more optimistic. On the other hand, it’s possible that the inventory accumulation could be reversed in coming quarters and growth slow as a result. Nonetheless, Tokyo stocks opened higher as a result and USD/JPY rose along with them, showing the usual positive correlation.
• Today’s highlights: The main event today will be the minutes of the April FOMC meeting. The minutes will probably show that FOMC members are still on track to vote for a rate hike at some point this year, as was mentioned several times from Fed speakers recently. The focus will be on how Fed officials see the recent weak growth data affecting their decision on when – or whether – to hike rates. How much of the slow economic growth in Q1 do they attribute to the bad weather conditions and the port strike? Investors will also be looking for any mention of how the strength of the dollar is affecting the US economy. Of course, their view on inflation will also be closely analyzed. If the minutes sound a bit hawkish and show optimism about the future, the dollar is likely to gain against its major peers.
• Besides the FOMC minutes, the Bank of England releases the minutes of its May meeting. We expect the minutes to resemble the tone of the recent inflation report and reiterate the MPC members view that “the next rate move more likely than not to be an increase.” We will be watching if there are still two members who see the risks as finely balanced and if any of the members who previously voted to hike rates are likely to resume pushing for a tightening any time soon. Another key point to watch will be any discussion of how the very low inflation rate has affected wage negotiations. There seem to be two camps on the MPC: those who think low inflation means wage demands will remain low, and those who think rising wage demands are likely to start pushing inflation higher.
• As for the indicators, During the European day, Norway Q1 GDP is expected to rise at a slower pace from the previous quarter. Following the below-expectations inflation rate last week, this may add further pressure on the Norges Bank to cut rates at its June meeting. This could prove NOK-negative.
• In Sweden, the official unemployment rate for April is expected to rise a bit. This could weaken SEK somewhat.
• Chicago Fed President Charles Evans speaks today.
The Market
EUR/USD collapses following Coeure’s comments
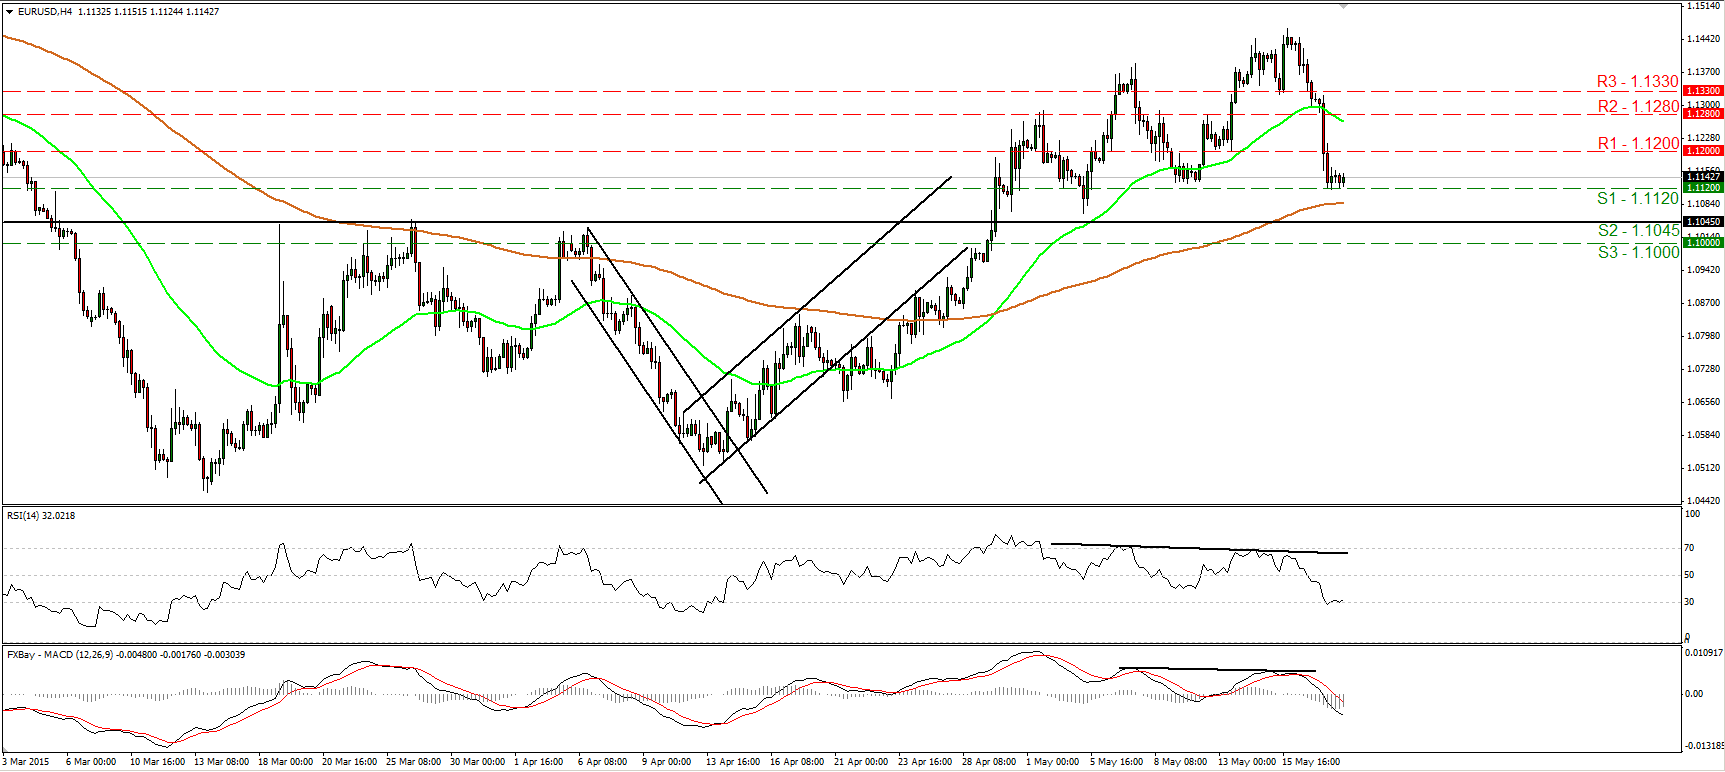
• EUR/USD collapsed on Tuesday, after ECB’s Coeure’s said that the Bank will “frontload” its QE program in May and June to avoid disrupting the market during the summer months. The rate plunged, violating two support (now turned into resistance) barriers in a row, and finding support around 1.1120 (S1). A break below that support would confirm a forthcoming lower low on the 4-hour chart and perhaps challenge the critical barrier of 1.1045 (S2) as a support this time. However, bearing in mind that the RSI hit support at its 30 line and could rebound from there, I would be careful of a possible upside bounce before the bears prevail again. As for the broader trend, the break above 1.1045 (S2) signaled the completion of a possible double bottom formation, something that could carry larger bullish implications. I would still treat any possible downside extensions that stay limited above 1.1045 (S2) as a corrective phase, at least for now.
• Support: 1.1120 (S1), 1.1045 (S2), 1.1000 (S3)
• Resistance: 1.1200 (R1), 1.1280 (R2), 1.1330 (R3)
GBP/USD falls after data showed that the UK fell into deflation in April
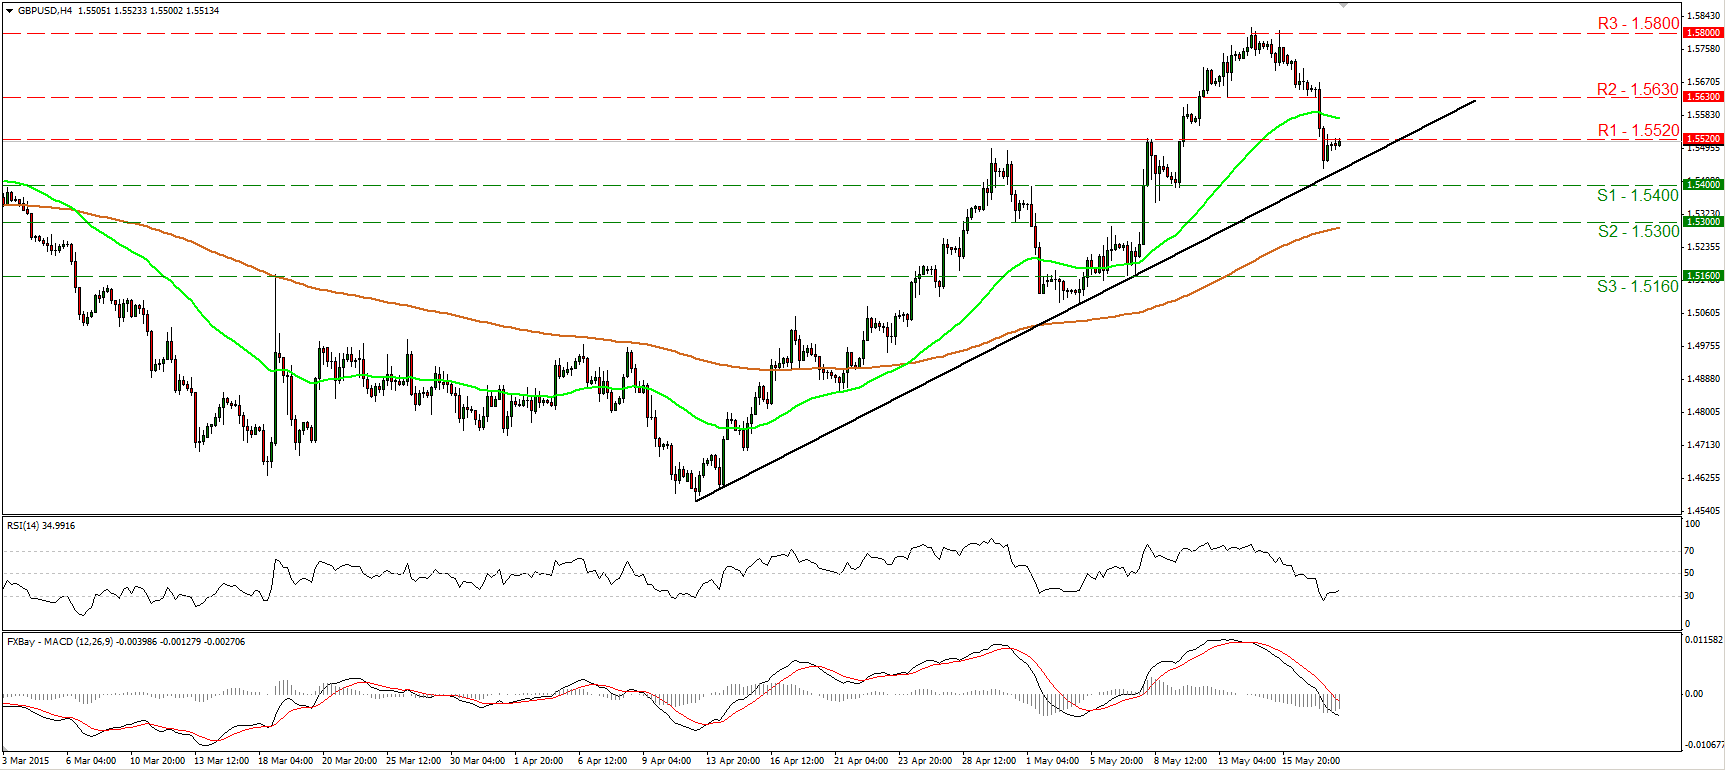
• GBP/USD tumbled on Tuesday after the UK inflation rate for April turned negative for the first time since 1960. Cable fell below 1.5630 (R2), and the decline was halted below the 1.5520 (R1) barrier, slightly above the uptrend line taken from the low of the 13th of April. Given that cable is trading above that trend line, the short-term picture is somewhat positive, in my view. A rebound near the trend line and a move back above 1.5520 (R1) is likely to confirm that and perhaps challenge again the 1.5630 (R2) line. Our momentum studies corroborate my view. The RSI rebounded from its 30 line and is now pointing up, while the MACD shows signs that it could start bottoming. On the daily chart, the rate is trading well above the 80-day exponential moving average. As a result, I would see a positive medium-term outlook as well.
• Support: 1.5400 (S1), 1.5300 (S2), 1.5160 (S3)
• Resistance: 1.5520 (R1), 1.5630 (R2), 1.5800 (R3)
EUR/JPY rebounds from an uptrend line
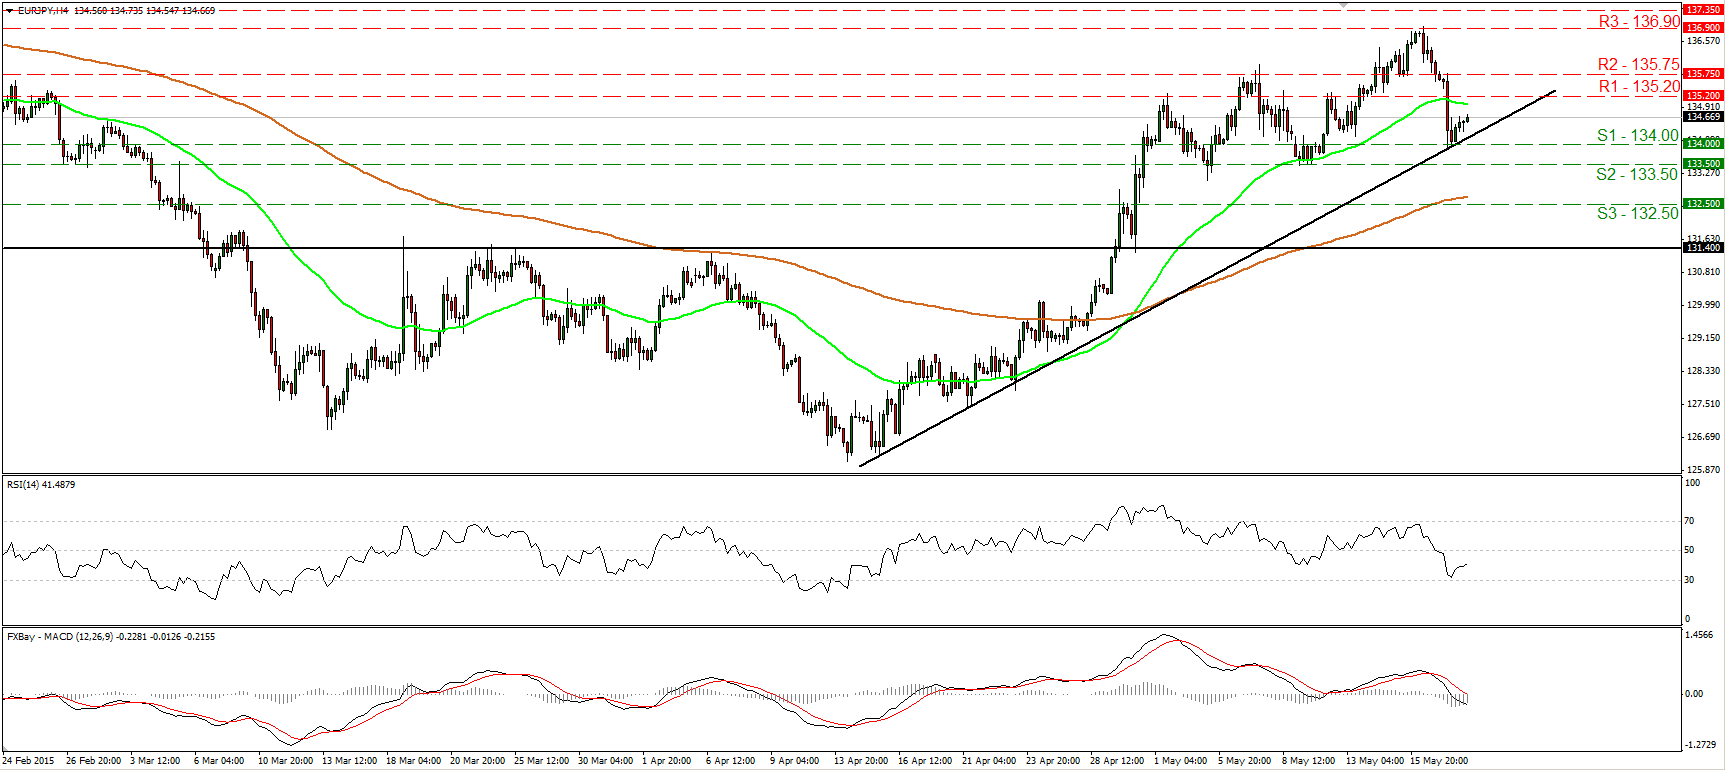
• EUR/JPY also tumbled on Coeure’s comments. It hit support at 134.00 (S1) and the uptrend line taken from back the low of the 15th of April. Nonetheless, the short-term outlook remains positive in my view. A rebound above 135.75 (R2) would confirm the resumption of the uptrend and perhaps challenge again Monday’s highs, at around 136.90 (R3). Our short-term momentum studies support the notion. The RSI rebounded from slightly above its 30 line and is pointing up, while the MACD shows signs that it could start bottoming. On the daily chart, the break above 131.40 on the 29th of April signaled a possible trend reversal in my view. This keeps the medium-term picture positive as well. As a result, I would treat any possible declines that stay limited above 131.40 as corrective moves.
• Support: 134.00 (S1), 133.50 (S2), 132.50 (S3)
• Resistance: 135.20 (R1), 135.75 (R2), 136.90 (R3)
WTI dives amid increased output by Saudi Arabia
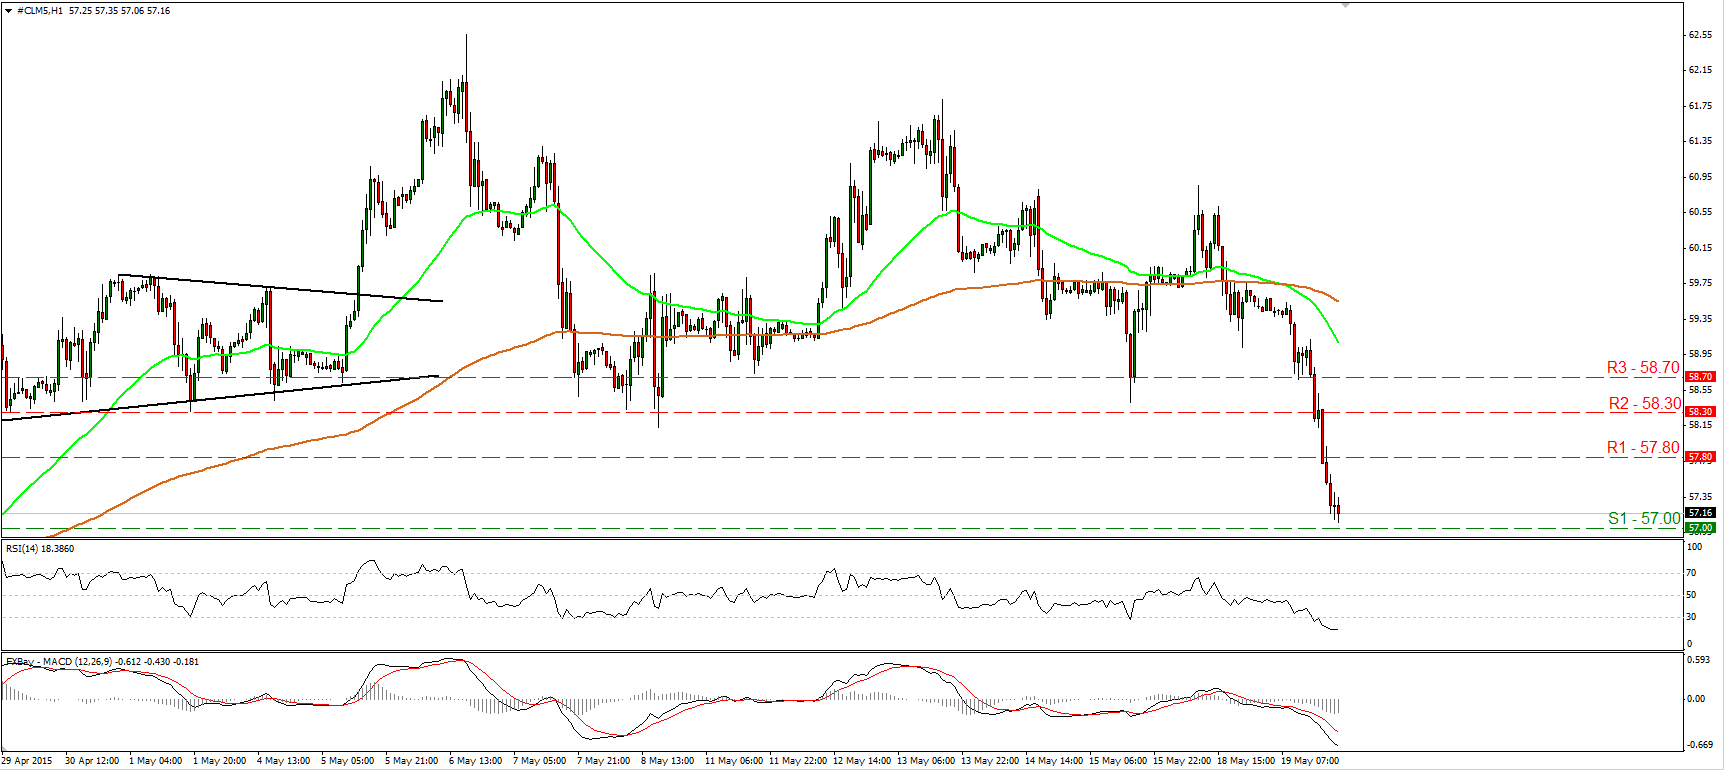
• WTI plunged after Saudi Arabian oil minister Al-Naimi said that the country had been pumping 10.3mn barrels per day in March. Crude oil violated three support barriers in a row on Tuesday, and during the European morning Wednesday, it is trading slightly above the 57.00 (S1) barrier. The short-term bias is negative in my view. Therefore, I would expect a dip below 57.00 (S1) to initially challenge our next support at 56.50 (S2), defined by the low of the 29th of April. Our daily momentum studies support the case for further declines. The 14-day RSI just fell below its 50 line, while the daily MACD has topped and fallen below its signal line. As for the broader trend, the break above 55.00 on the 14th of April signaled the completion of a double bottom formation, something that could carry larger bullish implications in the not-too-distant future. As a result, I would treat yesterday’s fall and any future extensions of it that stay limited above 55.00 as a corrective phase.
• Support: 57.00 (S1), 56.50 (S2), 56.10 (S3)
• Resistance: 57.80 (R1) 58.30 (R2), 58.70 (R3)
Gold tumbles and hits support around 1207
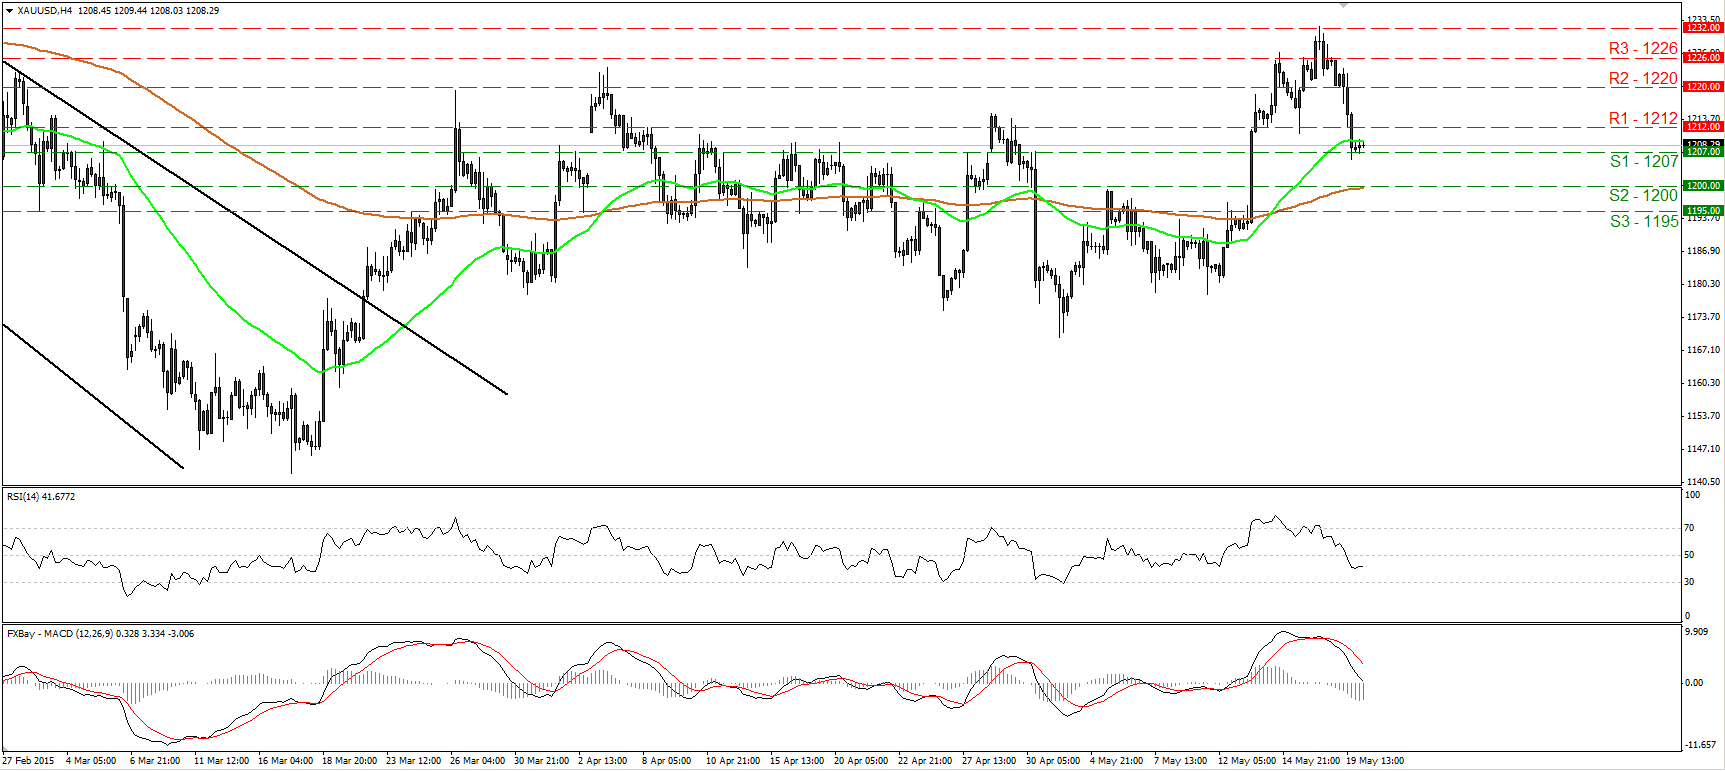
• Gold fell sharply on Tuesday after US building permits and housing starts for April beat market expectations. The plunge was halted by the support territory of 1207 (S1), but taking a look at our short-term oscillators, I see signs that the pullback could continue, perhaps to test at the psychological zone of 1200 (S2) as a support this time. The RSI fell below its 50 line, while the MACD, already below its signal line, is headed towards its zero line. It could turn negative soon. On the daily chart, Monday failed to close above 1226 (R3). I believe that a decisive close above that barrier is needed to turn the medium-term bias to the upside. For now, I will maintain my neutral stance as far as the longer-term trend is concerned.
• Support: 1207 (S1), 1200 (S2), 1195 (S3)
• Resistance: 1212 (R1), 1220 (R2), 1226 (R3)

