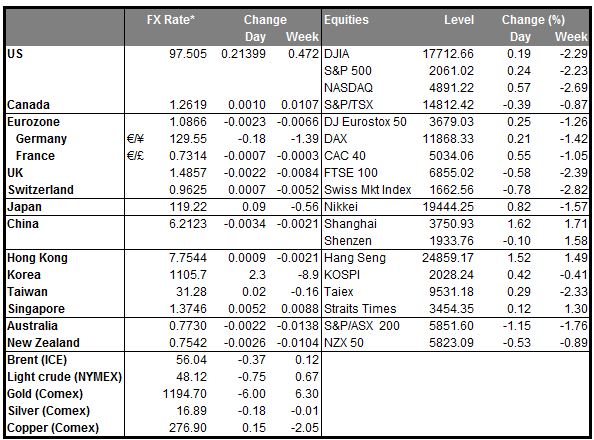
The dollar was opening higher in Europe against almost all the G10 currencies and the EM currencies that we track even though Fed funds rate expectations ended the day lower Friday and bond yields declined somewhat. Fed Chair Janet Yellen Friday said “conditions may warrant an increase in the federal funds rate target sometime this year” but that rates would rise “only gradually” and that tightening could even reverse if conditions warranted it. These comments were quite in line with what Fed officials have been saying up to now. Judging from the market response though, the statements increased the market’s conviction that a rate hike is coming (hence the stronger dollar) while lowering the market’s assumed path of rate increases (hence lower interest rates).
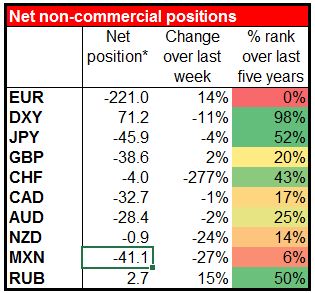
The Commitment of Traders (COT) report showed that while investors generally became less bullish on USD, reducing long DXY positions and closing out some short currency positions, they increased their net short EUR positions by a substantial 14% to a record short position. This suggests that in addition to USD strength, we are likely to see EUR underperformance in the coming week. Quantitative easing plus Greece’s troubles are probably behind that.
Greece the focus of attention again
Attention today is likely to focus on Greece as PM Tsipras updates Parliament on talks held over the weekend between the Greek government and the group of creditors formerly known as the troika (European Commission, ECB and the IMF). The Greek government apparently has submitted the long-awaited list of reforms to the lenders. According to the FT, officials who have seen the list said that while it contained some concessions, it depended too much on optimistic economic assumptions and suffered from the same lack of detail in some of the areas that have caused concerns during previous talks. In particular, the list failed to include reforms to labor laws and Greece’s pension system, two areas that monitors have insisted are essential to finalising the bailout program but that Greek officials say remain “red lines.” So there still remains a big gap between the two sides.
According to the Greek newspaper Kathimerini, even if there is a broad agreement between Greece and its creditors, it is unlikely that eurozone finance ministers will meet this week or even the week after to approve the release of even part of the EUR 7.2bn remaining in bailout money. Part of the reason is because of the Easter Sunday holiday, which falls this coming Sunday according to the Western calendar and the following Sunday according to the Greek Orthodox calendar. But also it appears that the technocrats have made only “limited progress,” the newspaper said.
The problem is, just how much longer does Greece have? How much more money does it have and how long can it finance itself for? Some reports have said that it will run out of money by April 8th. If so, and they still haven’t worked out their differences by now, then we could be in for some last-minute tensions.
Oil plunges on possible Iran settlement
Oil plunged Friday as diplomats worked towards a settlement of the Iranian nuclear issue. Settling that problem would free about 1mn b/d supply to come onto the world market, worsening the glut on the market. It may be that market participants expect Iran to co-operate in order to achieve an agreement, which not only would free Iranian oil for the market but also reduces the risk of a supply interruption from Saudi’s incursion into Yemen. I remain bearish on oil because of the increase in US supply, as I mentioned Friday, regardless of what happens with Iran. This would suggest long USD/CAD and USD/NOK positions could be profitable.
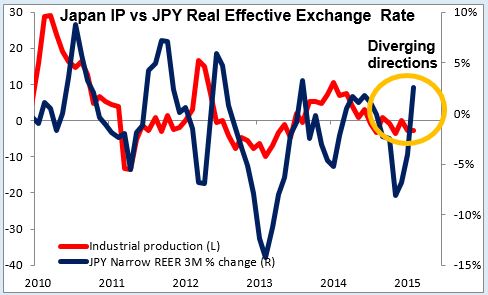
Japan industrial production fell in Feb Industrial production fell 3.4% mom, a larger decline than expected. Some of the decline could be due to the Chinese New Year in February. Nonetheless, the news highlights the fragility of Japan’s recovery and is likely reaffirm the administration’s commitment to a weaker currency to encourage exports. JPY-negative.
Today’s highlights: During the European day, German CPI for March is coming out, after several regional states release their data in the course of the morning. As usual, we will look at the larger regions for a guidance on where the headline figure may come in, as an indication for the near-term bias of the common currency. A better-than-expected headline figure could support EUR a bit.
The Swiss National Bank releases its weekly sight deposit data, which could show if the Bank intervened in the FX market in the week ended March 27. Indications of intervention could weaken CHF somewhat. So far the SNB does not seem to have intervened; on the contrary, deposits have decreased a bit. However, EUR/CHF has started to move down again recently and so it will be worth noting whether they have resisted the move.
In the UK, we get mortgage approvals for February.
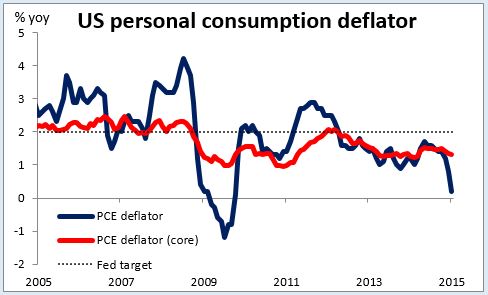
In the US, we get the personal income and personal spending for February. Personal income is expected to rise at the same pace as previously, while personal spending is anticipated to rise, a turnaround from the previous month. The nation’s yoy rate of the PCE deflator and core PCE are also coming out. The nation’s yoy rate of the PCE deflator is expected to rise a bit, while the core PCE rate is forecast to remain unchanged, in line with the 3rd estimate of Q4 core PCE in Friday’s GDP figures. Pending home sales for February and Dallas Fed manufacturing index for March are also coming out.
Rest of the week: On Tuesday, in the UK, the 3rd estimate of Q4 GDP is coming out. The final estimate of GDP figure is expected to confirm the preliminary reading. Therefore the market reaction could be minimal as usual. The 1st estimate of Eurozone CPI for March is also coming out. Following the introduction of the quantitative easing program by the ECB to boost growth and prices, the impact of the CPI on EUR is not as great as it used to. Daniele Nouy, Chair of the Single Supervisory Mechanism, will testify to the European Parliament. She may give some indication of how her department is getting along with the ECB Governing Council as they strive to regulate Greek banks while keeping the country from defaulting.
On Wednesday, during the Asian session, Bank of Japan releases its Tankan business confidence survey for Q1. All the indices for larger companies and the small companies are forecast to increase. This would be a favorable result for Japanese stocks and USD/JPY could rise as a result.
The manufacturing PMI figures for March from several European countries, the UK and the final figure for the Eurozone as a whole are also due out. As usual, the final forecasts for the French, the German and Eurozone’s figures are the same as the initial estimates. In the US, the main event will be the ADP employment report released as usual two days ahead of the NFP. The ADP report is expected to show that the number of new jobs in March increased from February, which would be USD-supportive. The ISM manufacturing PMI is also due out.
On Thursday, the only noteworthy indicator we get is the UK construction PMI for March. The minutes from the March ECB meeting will be released, which will shed some light on members’ views on QE.
Friday is NFP day! The market consensus is for an increase in payrolls of 250k in March, down from 295k in February. The expected increase in March seems moderate compared to the astounding increases in the recent months. Nonetheless it would still be a strong figure consistent with a firming labor market. The unemployment rate is forecast to remain unchanged at 5.5%, while the average hourly earnings are expected to accelerate a bit on a yoy basis. A robust labor report in line with estimates would keep the Fed on track to raise rates this year, which could help USD recover its lost glamour. Elsewhere in the world, Good Friday will be a national holiday in Europe, Australia, New Zealand and Canada.
The Market
EUR/USD trades virtually unchanged
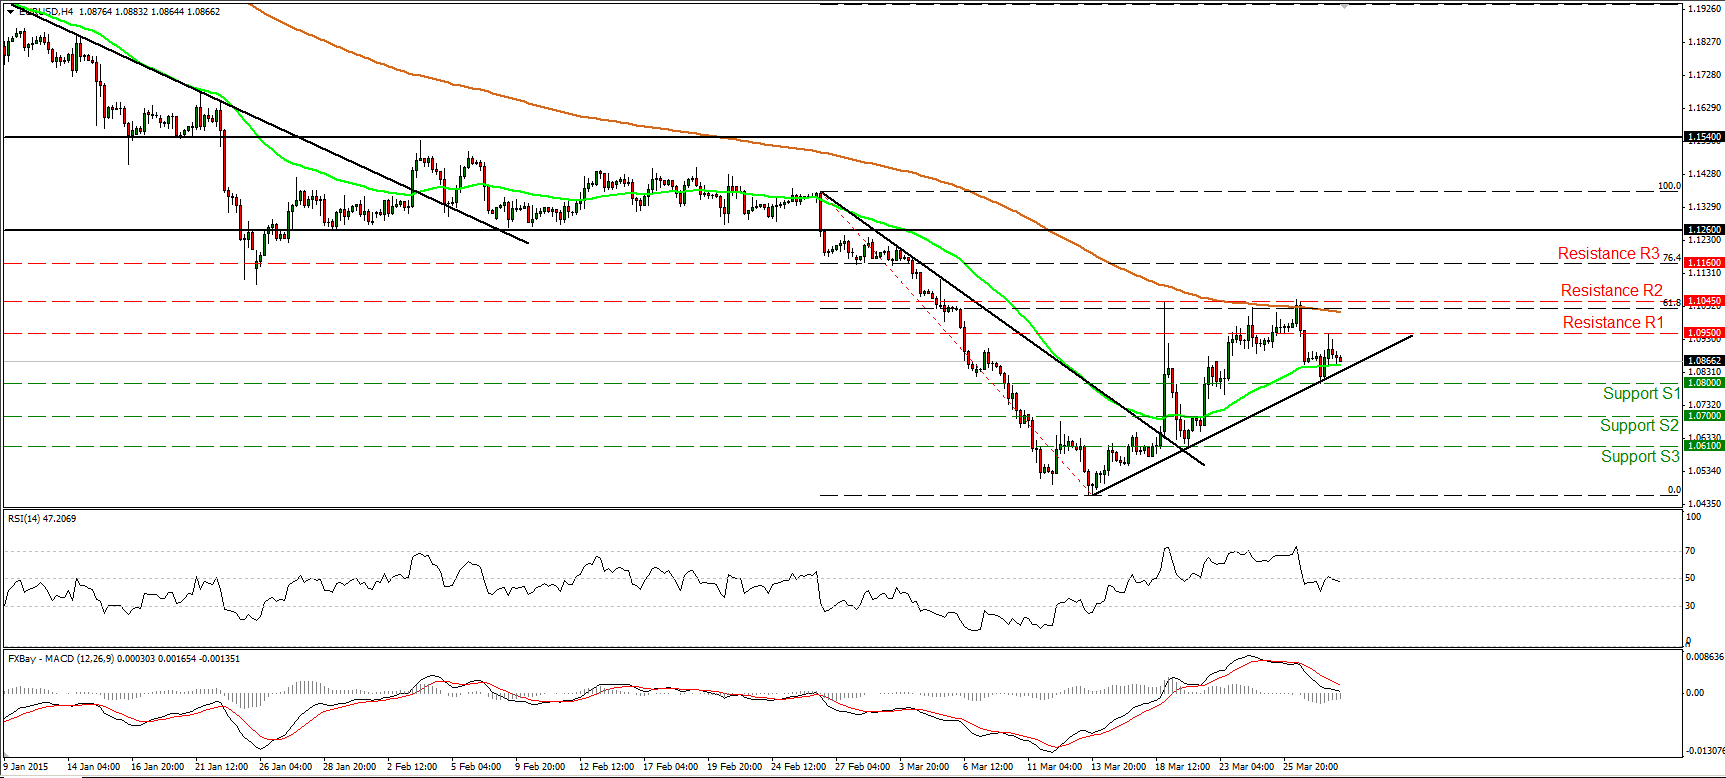
EUR/USD found support at 1.0800 (S1), rebounded to hit resistance at 1.0950 (R1), and then retreated somewhat to eventually trade virtually unchanged. The rate is trading above a possible uptrend line taken from the low of the 13th of March, but our momentum studies favor future declines. The RSI stands below 50 and points south, while the MACD lies below its trigger and could obtain a negative sign any time soon. Therefore, I would switch my stance to neutral at the moment. A break below the support of 1.0800 (S1) is the move that could turn the short-term bias to the downside in my view, and perhaps set the stage for extensions towards our next support obstacle at 1.0700 (S2). As for the broader trend, I still see a longer-term downtrend. The pair is forming lower highs and lower lows below both the 50- and the 200- day moving averages. As a result, I would treat the recovery from 1.0460 as a corrective phase of the larger down path.
• Support: 1.0800 (S1), 1.0700 (S2), 1.0610 (S3).
• Resistance: 1.0950 (R1), 1.1045 (R2), 1.1160 (R3).
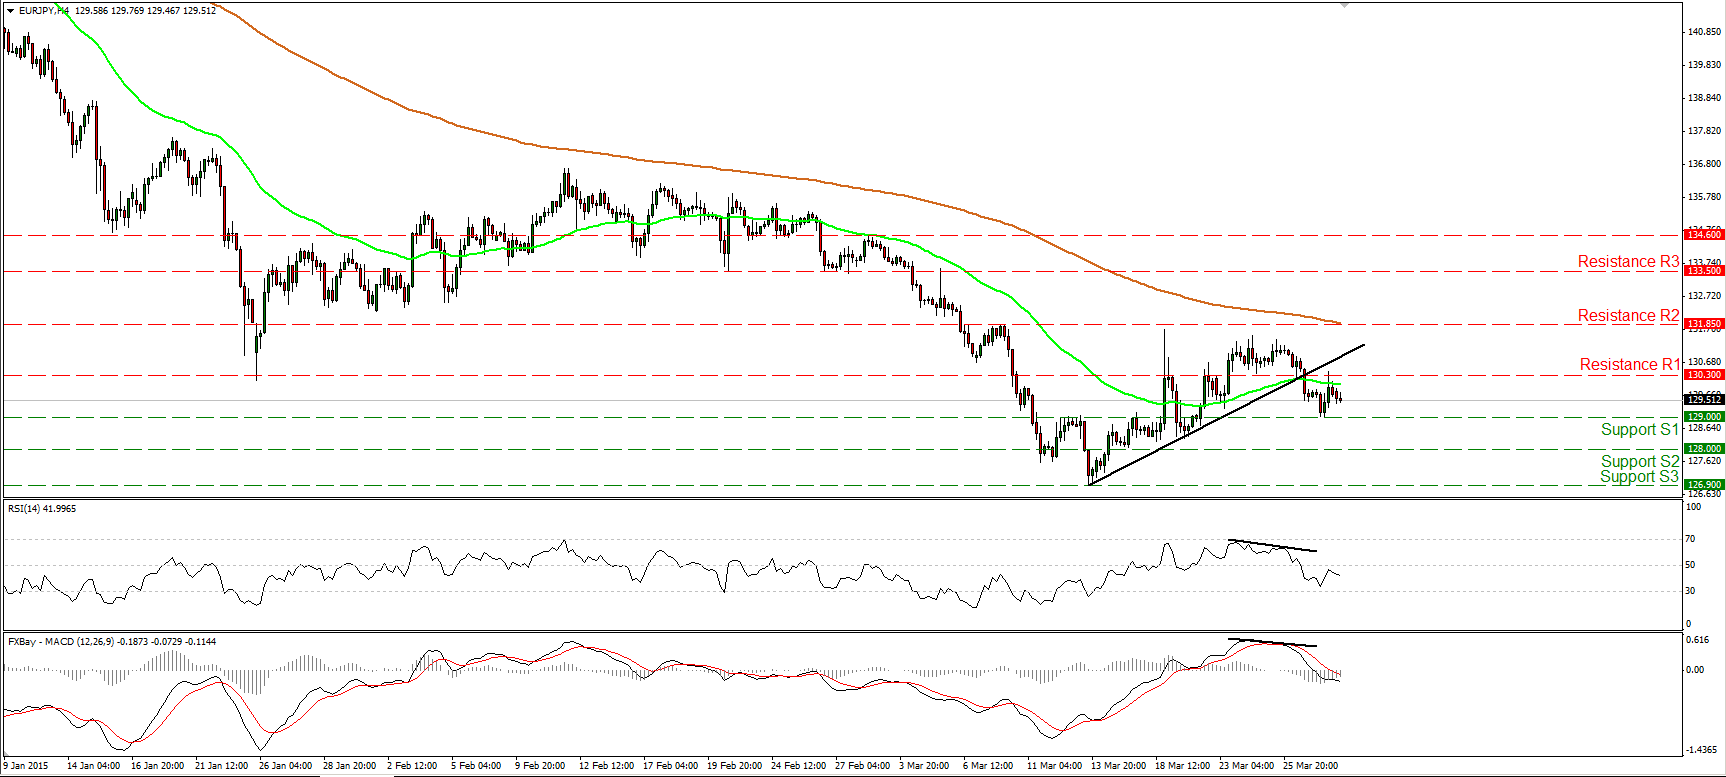
EUR/JPY turns down
EUR/JPY fell below the short-term uptrend line on Thursday, confirming the negative divergence between our short-term oscillators and the price action. On Friday, the rate rebounded somewhat but hit resistance marginally above 130.30 (R1) and slid again. In my opinion, the short-term picture has turned negative and I believe that a break below 129.00 (S1) could see scope for extensions towards 128.00 (S2). Our short-term momentum indicators support that scenario. The RSI found resistance slightly below its 50 line and turned down, while the MACD, already below its signal line, dipped into its negative field. As for the broader trend, I still see a longer-term downtrend. The recent switch in the short-term outlook corroborates my view that the recovery from 126.90 was just a retracement of the larger down path.
• Support: 129.00 (S1), 128.00 (S2), 126.90 (S3).
• Resistance: 130.30 (R1), 131.85 (R2), 133.50 (R3).
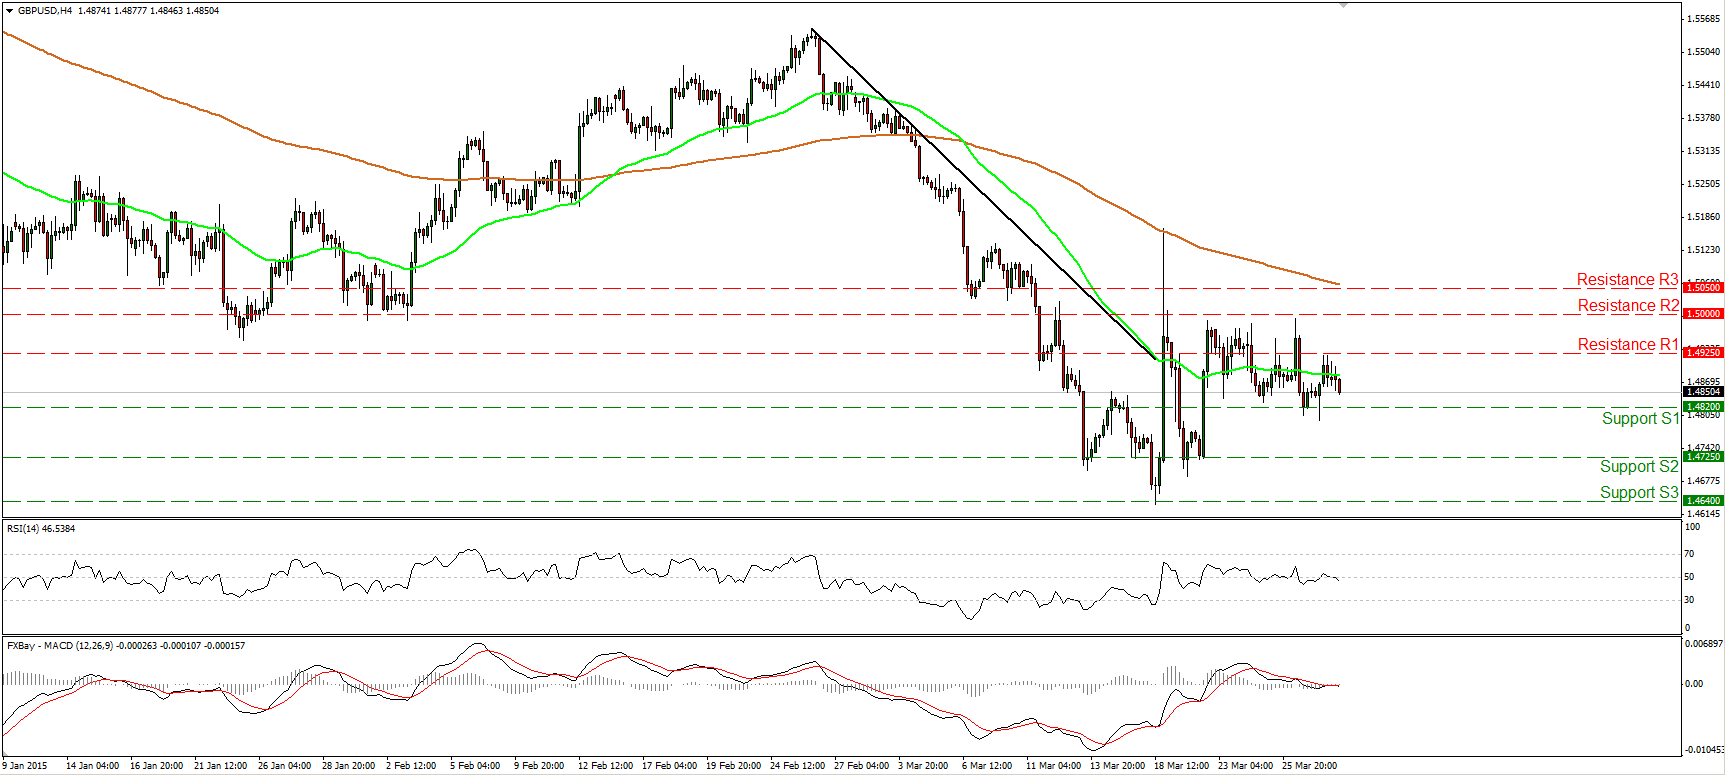
GBP/USD still in a trendless mode
GBP/USD moved somewhat lower after finding resistance at 1.4925 (R1). I would maintain the view that the short-term picture is neutral. The trendless outlook is also supported by our near-term momentum indicators. The RSI gyrates around its 50 line, while the MACD lies near it zero line and points sideways. However, zooming in on the 1-hour chart, our hourly oscillators amplify the case for a leg down. The 14-hour RSI fell below its 50 line, while the hourly MACD crossed below both its zero and trigger lines. A clear break below 1.4820 (S1) could confirm these momentum signs and perhaps pull the trigger for the next support barrier at 1.4725 (S2). As for the bigger picture, the price structure on the daily chart still suggests a larger downtrend. This is another reason I would expect the rate to exit its sideways range to the downside .
• Support: 1.4820 (S1), 1.4725 (S2), 1.4640 (S3).
• Resistance: 1.4925 (R1), 1.5000 (R2), 1.5050 (R3).
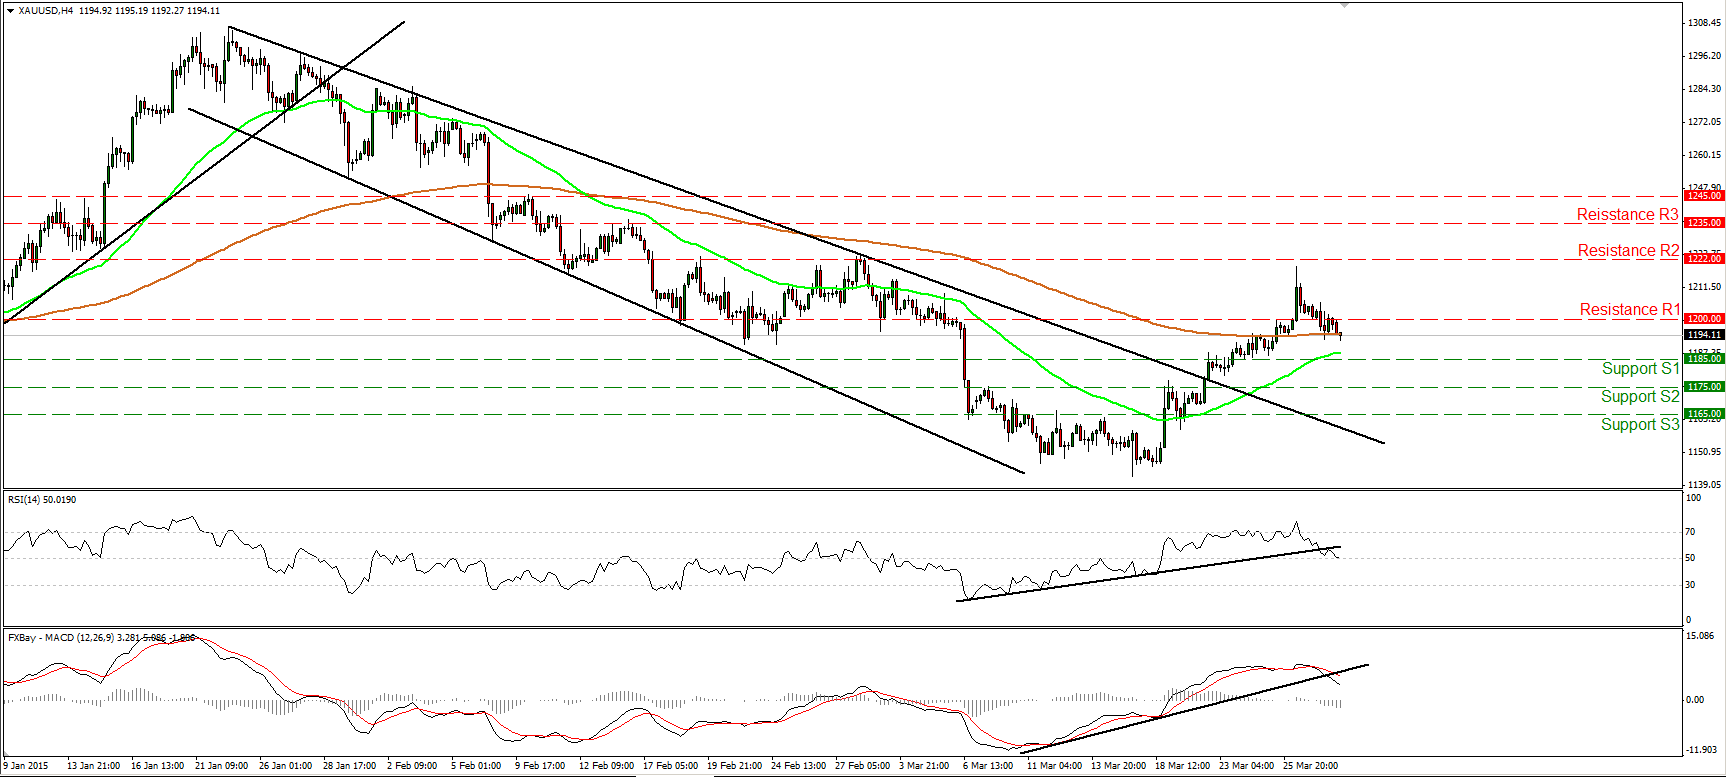
Gold pulls back below 1200
Gold slid on Friday and fell back below the psychological line of 1200 (S1). Taking into account our momentum signs, I would expect the tumble to continue and challenge our support line 1185 (S1). The RSI broke below its upside support line and looks ready to move below 50, while the MACD, already below its upside support line and below its trigger line, is pointing down. A decisive dip below 1185 (S1) could extend the decline, probably towards 1175 (S2). As far as the bigger picture is concerned, since the peak at 1307, the price structure has been lower highs and lower lows. I would consider the recovery from around 1140 as a corrective move which, having in mind the short-term picture, might be over.
• Support: 1185 (S1), 1175 (S2), 1165 (S3).
• Resistance: 1200 (R1), 1222 (R2), 1235 (R3).
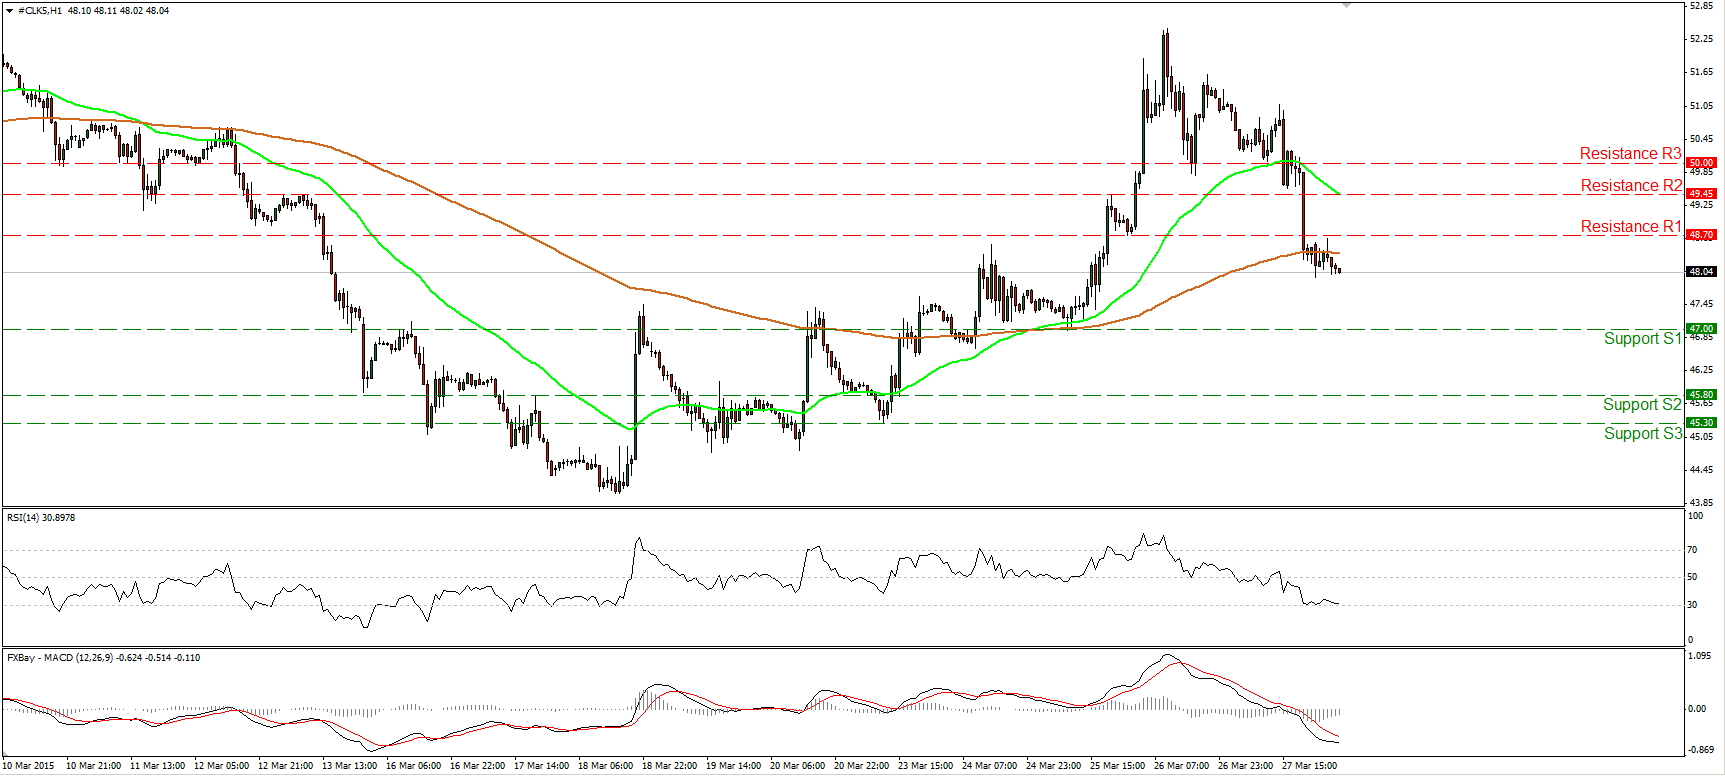
WTI trades back below 50
WTI collapsed on Friday, breaking below the key line of 50 and completing the failure swing top formation mentioned in Friday’s comment. WTI drilled three support barriers in a row and is now trading below 48.70 (R1). The outlook on the 1-hour chart has now turned negative and I would expect the bears to target the support line of 47.00 (S1). Our short-term momentum studies support the notion. The RSI continued lower and could move below its 30 line soon, while the MACD keeps falling below both its trigger and zero lines. On the daily chart, WTI is trading well below the 200-day moving average, and is now back below the 50-day one. This keeps the longer-term downtrend still intact. Nevertheless, there is positive divergence between the daily oscillators and the price action. Therefore, I would prefer to wait for price and momentum alignment before getting again confident on the larger down path.
• Support: 47.00 (S1), 45.80 (S2), 45.30 (S3).
• Resistance: 48.70 (R1) 49.45 (R2), 50.00 (R3).

