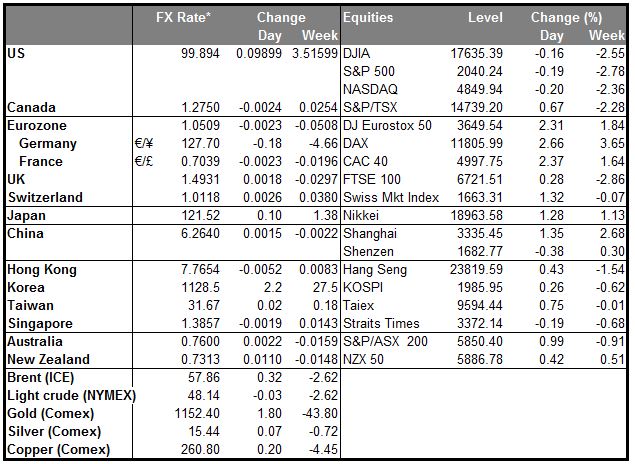
EUR continues to collapse as USD broad currency index breaks out of 30-year downtrend.The euro continued its collapse yesterday as more and more market participants jumped on the trend. People were waiting to hear some comments from ECB officials about how enough is enough, the pace of decline is too much, or something like that, but ECB President Draghi, and ECB Governing Council Member Ewald Nowotny made no such comments. On the contrary, Nowotny said recent developments are not “totally unusual” and exchange rates “are not a major dominant factor” for the global economy. He said it would be wrong to frame the euro’s decline as a currency war. Italian Finance Minister Pier Carlo Padoan said the dollar’s appreciation vs the euro was in line with the economic fundamentals, so no complaints there. Meanwhile, St. Louis Fed President James Bullard said the Fed was already late in hiking rates. Monetary policy divergence lives!
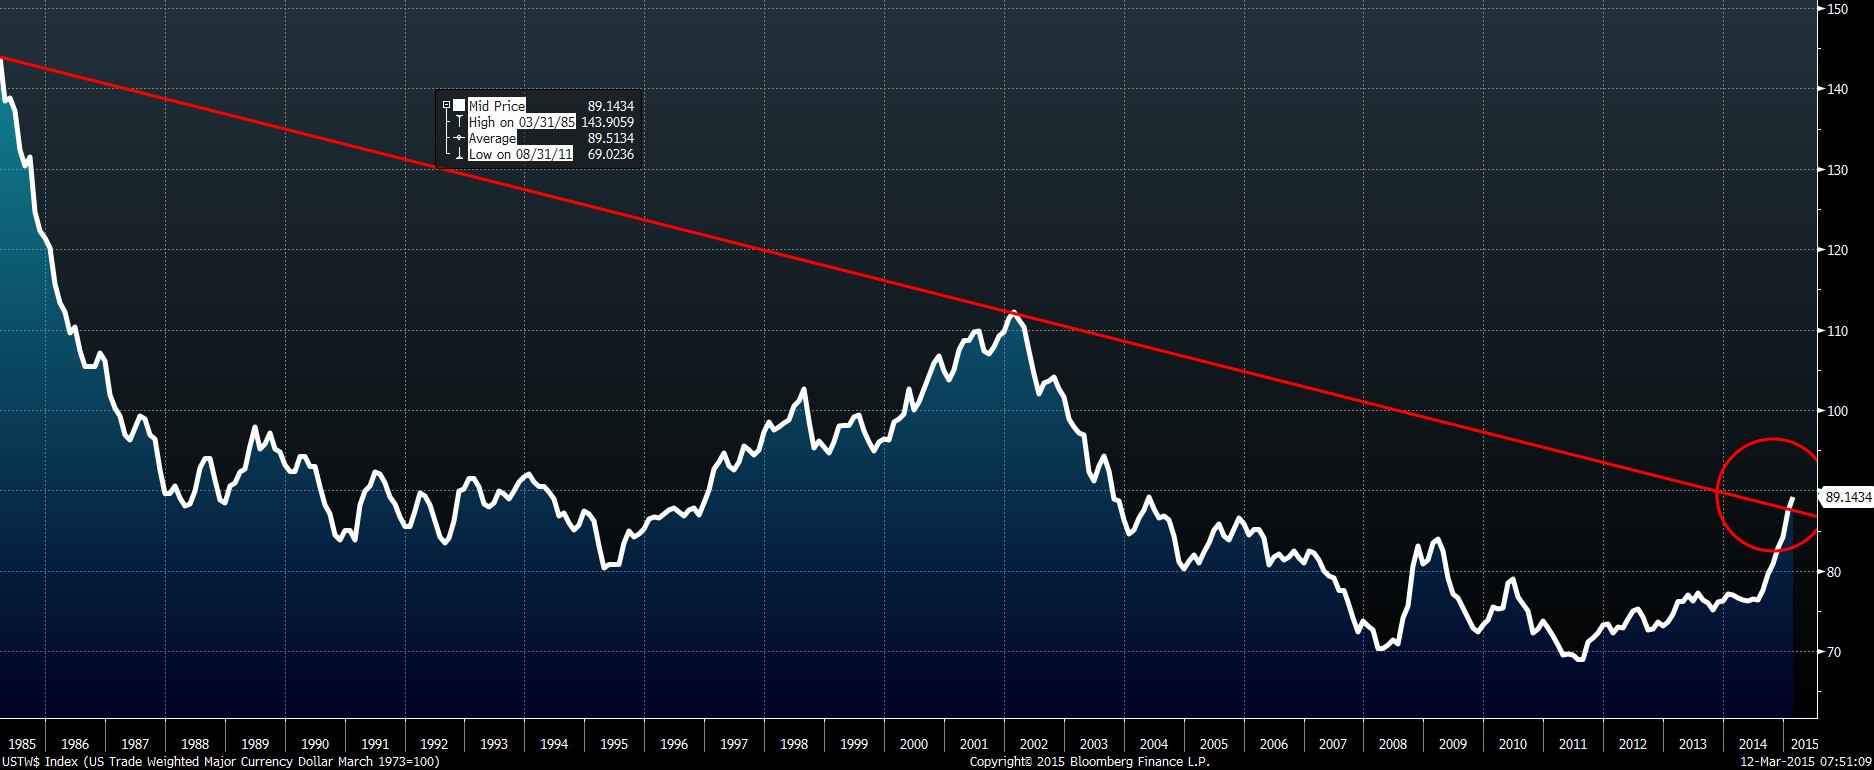
USD broad currency index breaks out of downtrend I highlighted in the past how the DXY index has broken out of its 30-year downtrend. Over the last several days, the same thing has happened to a much broader, more representative index of the dollar’s value, the Fed’s major currency trade-weighted index. This index includes Australia, Canada, Japan, Sweden, Switzerland, the UK and the eurozone countries and is much more rationally weighted than the bizarre DXY index. The breakout here confirms to me that we are still at the start of a broad USD rally.
RBNZ remains on hold The Reserve Bank of New Zealand kept interest rates unchanged and signaled an extended period of steady interest rates. Their emphasis was on growth, not inflation, which they indicated would not be a concern even if (when?) it falls to zero unless there started to be second-round effects on wages and prices. They were more optimistic than they were back in January about the New Zealand economy, which they said “remains strong,” a new addition to the statement. “Our situation is quite different from some of those countries that have changed monetary policy or cut interest rates,” Gov. Wheeler said at the press conference following the meeting. He noted that the New Zealand economy was growing at 3.25%-3.5% and is expected to continue to grow at those rates for the next two years. While they lowered their forecast for market rates, they signaled that they would keep the Official Cash Rate (OCR) steady for some time. “Our central projection is consistent with a period of stability in the OCR” they said, a slight change from January’s formula, “we expect to keep the OCR on hold for some time,” but the next part of the statement was identical: “However, future interest rate adjustments, either up or down, will depend on the emerging flow of economic data.”
NZD strengthened after the report on the idea that rates would be on hold for some time and then eventually start to rise. Nonetheless, I think they could be signalling intervention in the FX market to weaken the currency. Their comment on the exchange rate was even stronger than it was in January: they added a sentence saying “A substantial downward correction in the real exchange rate is needed to put New Zealand’s external accounts on a more sustainable footing.” I see NZD depreciating vs USD but appreciating against AUD, which is more heavily leveraged to Chinese investment.
RBA lowers AUD target RBA assistant governor Christopher Kent yesterday repeated the RBA’s mantra that AUD is still too high. “While the depreciation seen to date will be helpful, our assessment is that our exchange rate remains relatively high given the state of our overall economy,” he said. The comment was particularly significant because AUD/USD yesterday hit 0.7561, meaning it had reached the 0.75 level that RBA Gov. Stevens identified back in December as “an appropriate valuation” for the currency. I think Kent’s comments signal a change in view at the RBA, because the state of the economy and the outlook for the Australian economy have worsened since December. His comments tie in with a speech, Deputy Gov. Philip Lowe made last week in which he noted that monetary policy is less effective than it used to be, because of the high level of existing debt – a fall in rates does not elicit the same increase in borrowing that it used to and therefore does not boost growth as much as it did in the past. Reading between the lines of the two speeches, it appears to me that the Australian authorities expect that they will have to rely more on exchange rate depreciation in order to boost growth. This is why I remain particularly bearish on AUD.
Today’s highlights: German final CPI for February came at -0.1% yoy, unchanged from the preliminary estimate, as expected. Eurozone’s industrial production for January is also coming out.
In Sweden, the official unemployment rate for February is expected to decline, in line with the PES unemployment rate released on Wednesday. Following the encouraging CPI data, decline in the unemployment rate could suggest an improving economy and support SEK temporarily.
In the UK, trade deficit for January is expected to narrow a bit. The BoE also publishes its quarterly bulletin.
In the US, headline retail sales for February are forecast to have rebounded after falling in January, while the core retail sales are expected to accelerate. The focus is usually on the core retail sales, which excludes auto and gasoline, thus the report could add to the greenback’s strength. Initial jobless claims for the week ended March 7 is also coming out.
As for the speakers, RBNZ Governor Graeme Wheeler speaks at the Finance and Expenditure Select Committee on monetary policy statement. ECB Executive Board member Benoit Coeure, ECB Governing Council member Jens Weidmann speak, while Bank of England Governor Mark Carney speaks for the second time this week.
The Market
EUR/USD reaches 1.0500
EUR/USD continued its tumble on Wednesday and today. During the Asian morning it hit support near the psychological barrier on 1.0500 (S1). The short-term bias stays negative and I would expect a clear move below 1.0500 (S1) to set the stage for extensions towards 1.0360 (S2), defined by the low of the 8th of January 2003. The RSI, already below 30, turned again south, while the MACD continued deeper into its negative territory, also below its trigger line. These momentum signs show strong downside speed and amplify the case for further declines. However, zooming on the 1-hour chart, there is positive divergence between both our hourly momentum studies and the price action, thus I would be careful that a minor bounce could be looming before the next leg down. With regards to the broader trend, I believe that the pair is still in a downtrend. EUR/USD is printing lower peaks and lower troughs below both the 50- and the 200-day moving averages.
• Support: 1.0500 (S1), 1.0360 (S2), 1.0185 (S3).
• Resistance: 1.0565 (R1), 1.0665 (R2), 1.0800 (R3).
GBP/USD breaks below the lows of January
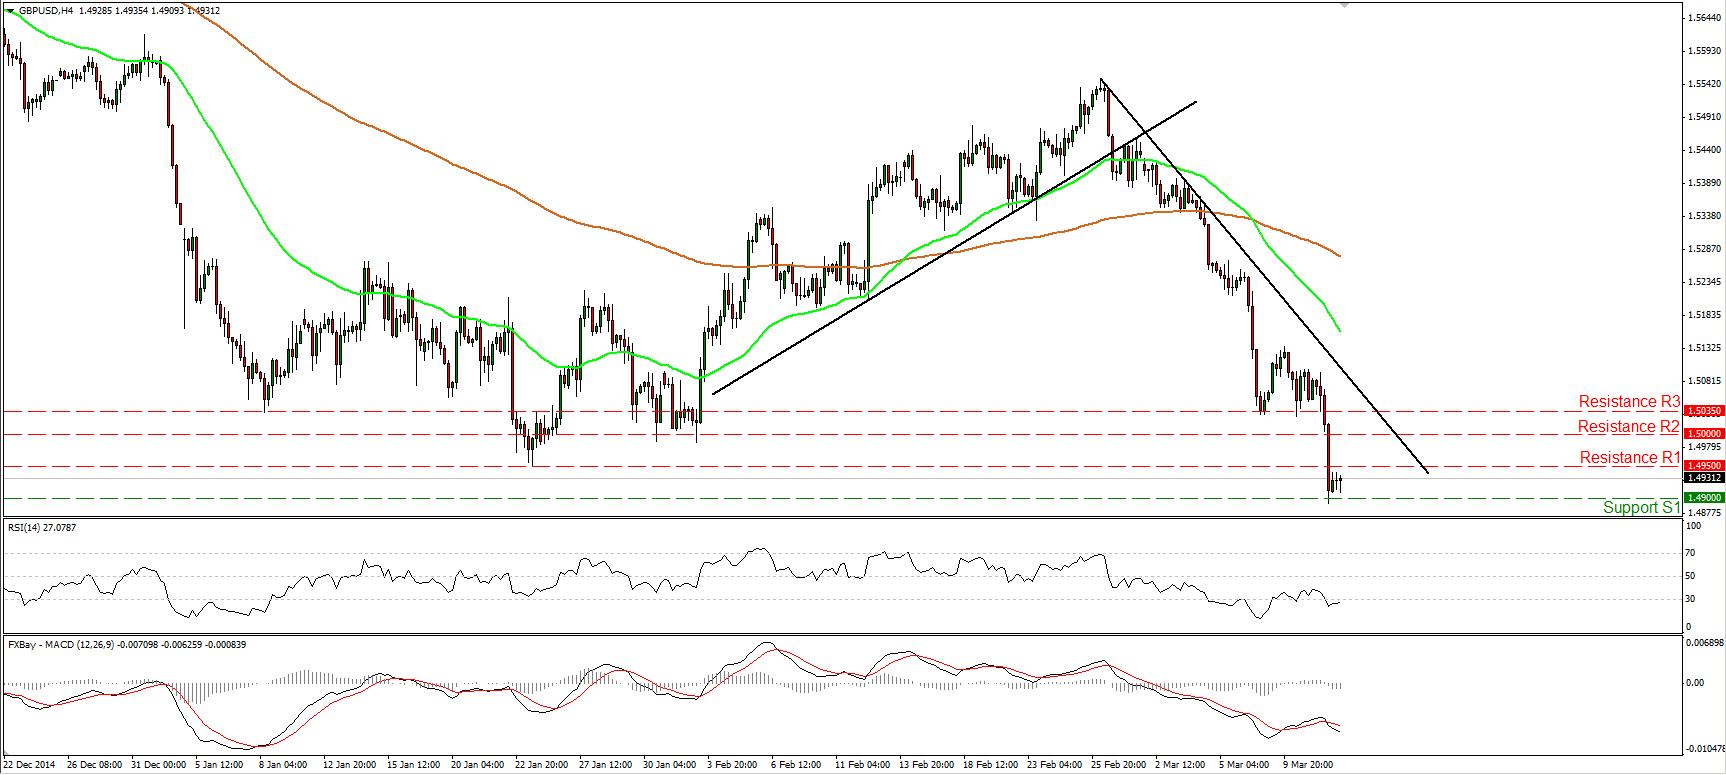
GBP/USD kept falling to trade back below 1.5000 (R2) and below the support (now turned into resistance) obstacle of 1.4950 (R1), marked by the low of the 23rd of January 2013. The price structure has been lower peaks and lower troughs since the 26th of January, thus the near-term bias is negative and I would expect the bears to continue pushing the price lower and to challenge the 1.4900 (S1) zone once more. Nonetheless, taking into account that the RSI tries to exit again its oversold field, we could see a minor corrective bounce above 1.4950 (R1) before sellers take control again. In the bigger picture, the break below 1.4950 (R1) confirmed a forthcoming lower low on the daily chart and turned the overall outlook of Cable back to the downside.
• Support: 1.4900 (S1), 1.4820 (S2), 1.4680 (S3)
• Resistance: 1.4950 (R1), 1.5000 (R2), 1.5035 (R3)
USD/JPY pulls back and hits support at 120.85
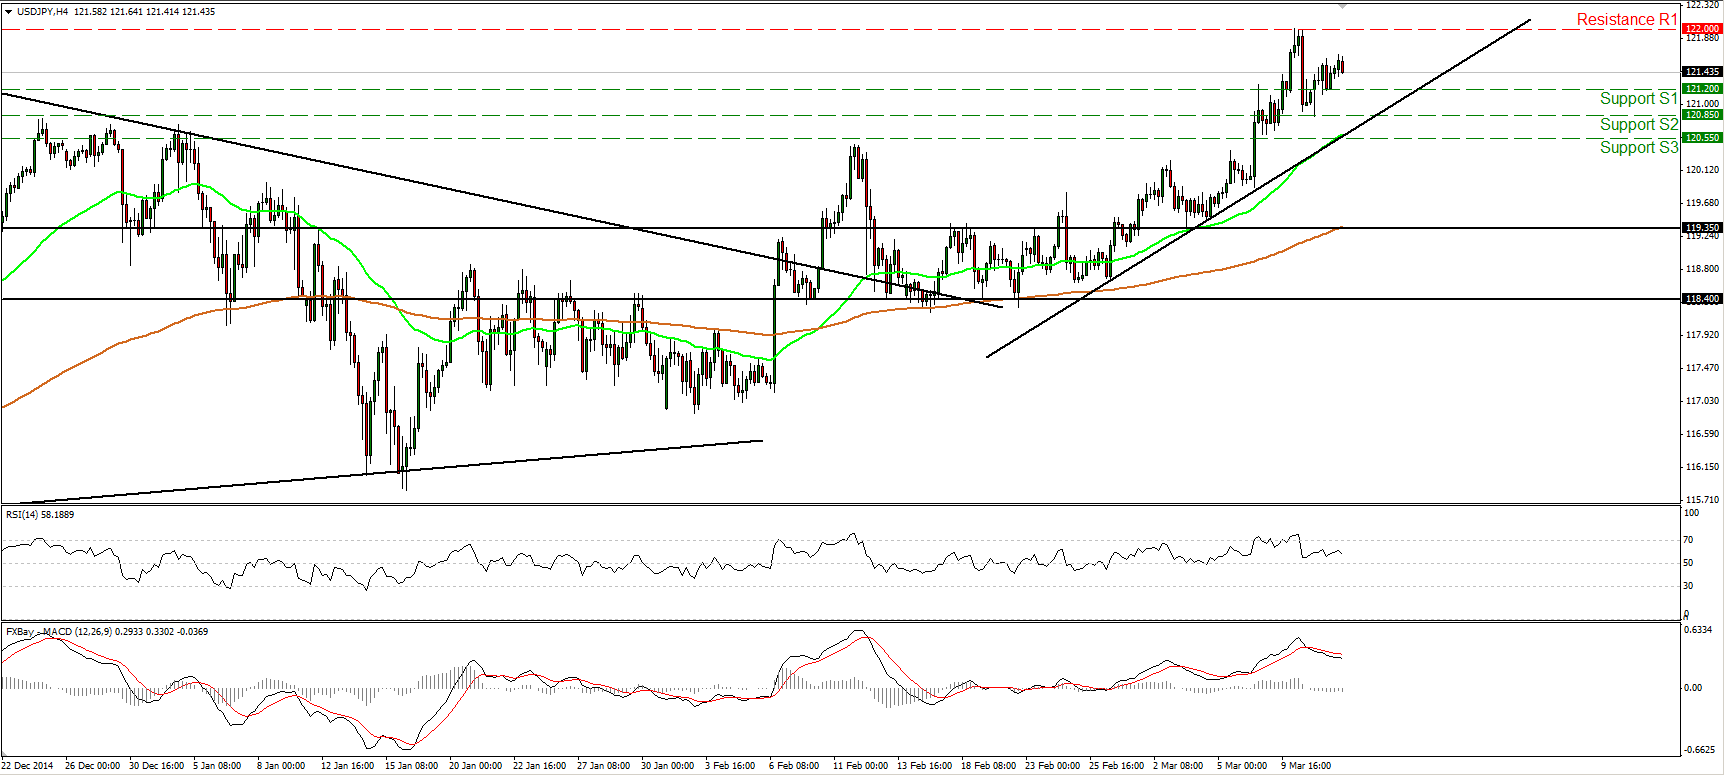
USD/JPY pulled back after hitting the 122.00 (R1) line, pulled back, hit support near 120.85 (S2) and rebounded. The rate is still printing higher highs and higher lows above both the 50- and the 200-period moving averages, thus the near-term bias remains to the upside. I still believe that we are likely to see the rate challenging the 122.50 (R2) line, marked by the high of the 20th of July 2007. Our daily oscillators detect positive upside speed and magnify the case for a higher rate. The 14-day RSI moved higher and is now approaching its 70 line, while the MACD stands above both its zero and signal lines and points up. As for the broader trend, the rate is still trading above both the 50- and the 200-day moving averages, and above the upper bound of the triangle that had been containing the price action since November. This keeps the overall picture of USD/JPY positive.
• Support: 121.20 (S1), 120.85 (S2), 120.55 (S3).
• Resistance: 122.00 (R1), 122.50 (R2), 124.00 (R3).
Gold hits 1150
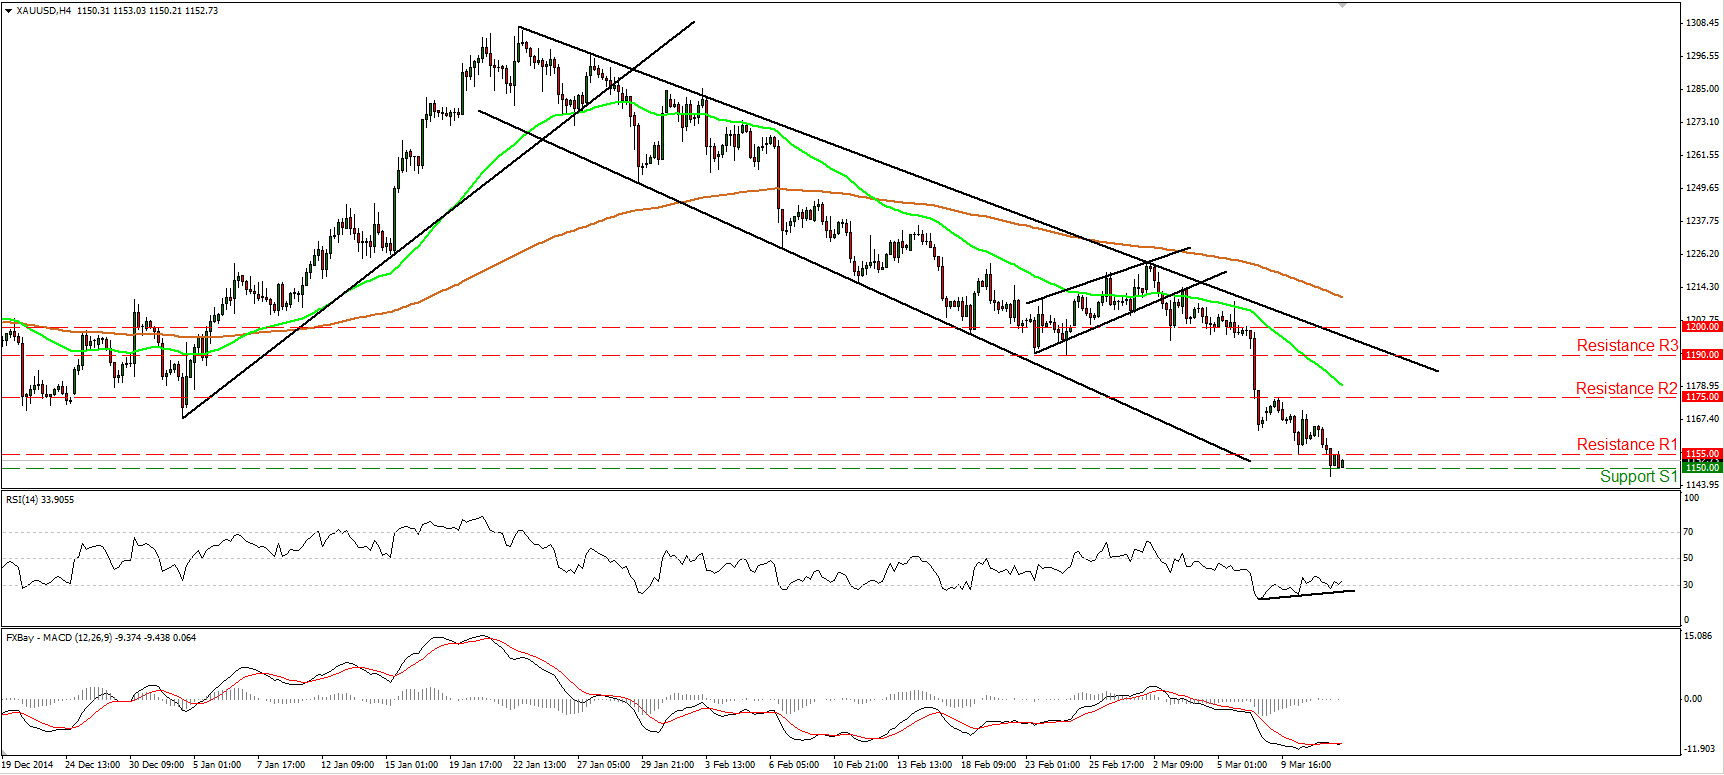
Gold traded lower on Thursday and managed to reach our support obstacle of 1150 (S1). The precious metal is still trading below both the 50- and the 200-period moving averages, and below the downtrend line taken from back at the high of the 22nd of January. Therefore I still consider the short-term outlook to be negative and would expect a break below 1150 (S1) to have more bearish extensions and perhaps trigger extensions towards the 1140 (S2) zone. However, there is still positive divergence between the RSI and the price action, thus I would stay cautious that an upside corrective move could be in the works before sellers take control again.
• Support: 1150 (S1), 1140 (S2), 1130 (S3).
• Resistance: 1155 (R1), 1175 (R2), 1190 (R3).
WTI triggers some buy orders near 47.40
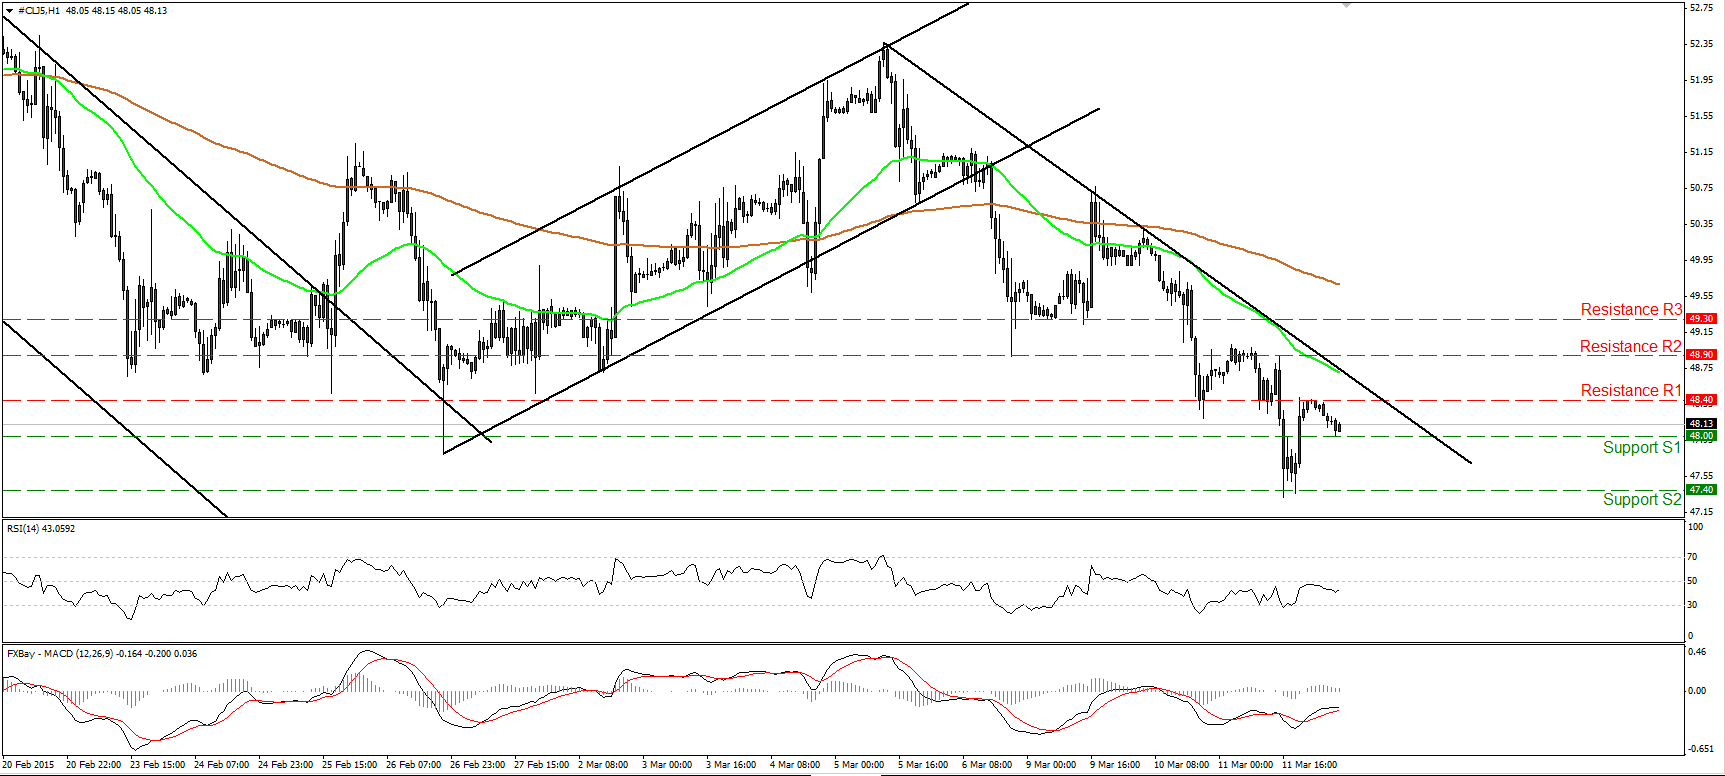
WTI plunged on Wednesday, but triggered some buy orders near our support hurdle of 47.40 (S2) and rebounded to hit resistance at 48.40 (R1). Given that the price is trading below the downtrend line taken from the peak of the 5th of March, I still consider the short-term outlook to be to the downside. I would expect a move below the 48.00 (S1) obstacle to pull the trigger for another test at the 47.40 (S2) area. On the daily chart, WTI is still trading below both the 50- and the 200-day moving averages. It also managed to move below the low of the 26th of February. Meanwhile, the 14-day RSI left its 50 line and moved lower, while the MACD slid below both its zero and signal lines. This shifts the longer-term bias cautiously back to the negative, in my opinion.
• Support: 48.00 (S1), 47.40 (S2), 46.65 (S3).
• Resistance: 48.40 (R1) 48.90 (R2), 49.30 (R3).


