• When the irresistible force of Democracy met the immovable object of Bureaucracy, guess who won? Greece Friday capitulated as more and more money left the Greek banking system (estimated EUR 800mn a day) and it became clear that capital controls would be necessary soon if an agreement wasn’t reached. Moreover, the Greek government would have run out of money in any event. Greece basically had to accept virtually all the demands of its creditors: asking for an extension of the hated reform program, complete with monitoring by the troika, and promising not to roll back reforms introduced by previous governments or to introduce any new measures that will widen the deficit. In return, Greece’s creditors agreed to extend its current bailout agreement for four months. I could see only two concrete concessions: 1) the troika was renamed “the three institutions,” and 2) Greece will be able to propose its own list of reforms instead of having them imposed from outside. But of course those reforms have to be acceptable to the creditors, so there is not that much leeway.
• Greece will submit to the Eurogroup by this evening a lists of proposed reforms, such pledges on structural issues such as tax evasion, corruption and public administration. If satisfied, they will endorse the list, which then goes to the various parliaments in the eurozone for ratification. The Greek Parliament also has to approve the agreement, and some Syriza members could vote against it.
• Despite all the drama accompanying the negotiations, the agreement is only a temporary measure that simply allows for a breathing space while negotiations continue. First off, the agreement leaves several important issues unresolved, such as what reform measures Greece must adopt in order to get various aid payments. Secondly, the money will go to paying the interest on Greece’s debt, not to helping the Greek economy, so in fact the troika is agreeing to bail out European banks, not Greece. Most importantly, the financing lasts for only four months, meaning it ends right before Greece must make two crucial bond payments to the ECB totaling EUR 6.7bn. Greece does not have the money to make these payments, therefore discussions are likely to begin “very soon” on a possible third bailout for the country.
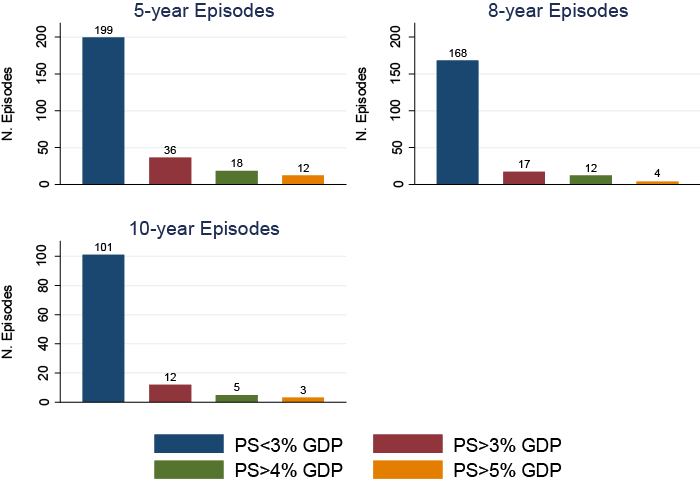
• During the four months, the two sides will negotiate the target for Greece’s fiscal position. Under the previous agreement, Greece was supposed to run a primary budget surplus – surplus before interest payments – of 3% this year and 4.5% in 2016. The EU wants Greece to run such a big surplus so that the country’s debt can fall from 175% of GDP currently to 110% by 2022. To call this “wishful thinking” is an overstatement, because that would imply it involves thinking as well as wishing, when in fact it is just wishing. One study of 54 countries from 1974 to 2013 found that only about 15% of the time did countries manage to run a primary surplus of at least 3% of GDP for five years, and surpluses of 4% of GDP for more than a decade were extremely rare (only five countries). The Greeks want a write-down of their debt so that they can manage to meet their debt/GDP targets with a more reasonable 1.5% primary surplus. One major concession: Eurogroup President Jeroen Dijsselbloem said that Athens may be able to lower the budget surplus target, which is a key demand of the new government.
• Nonetheless, the negotiation over this point is likely to be difficult as it will encompass a wide-ranging discussion about debt sustainability and the potential growth rate of the Greek economy. We can expect a last-minute crunch similar to what we saw this time around. The difference is that this time, the government was elected and immediately thrown into negotiations with a two-week deadline. It didn’t have any time to prepare. The next time, Athens will have four months to figure out a “Plan B” in case the eurozone doesn’t go along with its proposals. Having a well-thought-out alternative, which could include leaving the eurozone, could boost Greece’s bargaining position substantially. It could also make a Grexit more likely as there will be more time on both sides to prepare for that possibility.
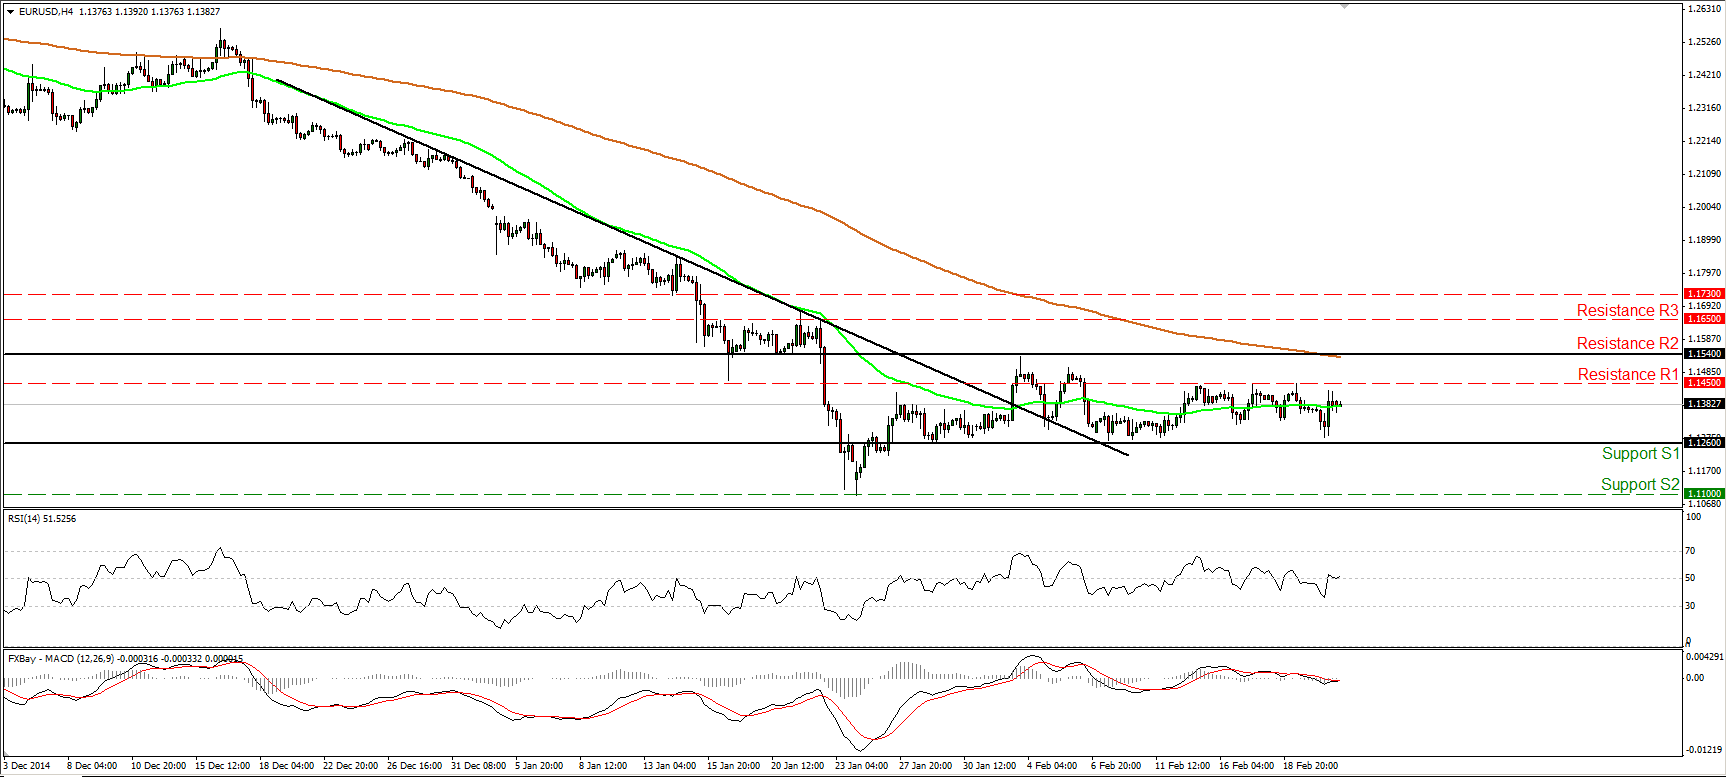
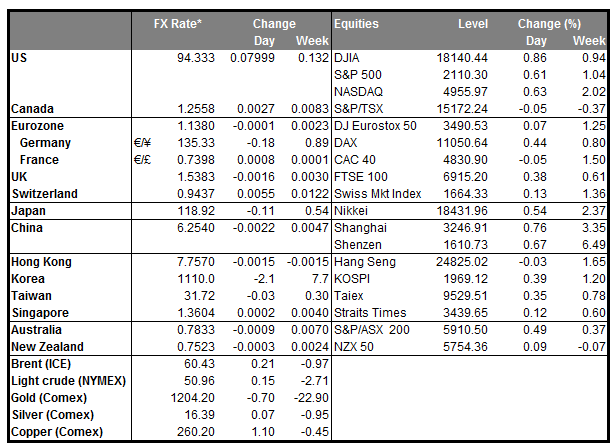
• FX market impact: EUR/USD bounced back from the lows on Friday after the news, but failed even to touch the 1.1450 highs of Tuesday or Thursday, and is opening in Europe at around 1.1377 – virtually unchanged from its 1.1363 opening on Friday. The market’s verdict therefore appears to be that while the talks were successful (hence no further declines in EUR/USD), they were not so successful as to improve the prospects for EUR. The underlying tensions within the euro remain, plus the pressure of the QE program that will start next month. I remain bearish on the euro.
• Today’s highlights: Aside from Greece, the main point of interest today is the German IFO survey for February. All three indices are expected to have risen. Following the strong ZEW survey released last Tuesday, this would add to the growing confidence that Europe’s largest economy is reviving. It could strengthen EUR a bit, but of course the currency depends more on what happens to Greece.
• The Swiss National Bank releases its weekly sight deposit data, which could show if the Bank intervened in the FX market in the week ended Feb. 20. Deposits were unchanged in the previous week, suggesting that there was little if any intervention.
• In the US, existing home sales for January are forecast decrease a bit. The housing starts and building permits released last week were consistent with an improving housing market. If the existing home sales are in line with a strong housing sector, this may be USD-supportive. Dallas Fed manufacturing index is also coming out.
• As for the rest of the week, the highlight will be Fed Chair Janet Yellen’s twice-a-year report on monetary policy to Congress (the Senate on Tuesday and the House of Representatives on Wednesday). Also on Tuesday, Bank of England Governor Mark Carney and other MPC members testify to the House of Commons Treasury Committee. On Wednesday, ECB President Mario Draghi testifies to the European Parliament in Brussels. Finally on Friday, we have the usual end-of-month data dump from Japan, including the important CPI figures.
The Market
EUR/USD rebounds after Greek deal
• EUR/USD rebounded strongly from marginally above the key support hurdle of 1.1260 (S1) on Friday after Eurogroup agreed to extend Greece’s bailout program by four months. Nevertheless, the pair continues to oscillate between the aforementioned support and the resistance of 1.1540 (R2), thus I would maintain my “wait and see” approach as far as the short-term horizon is concerned. With regards to the broader trend I believe that the pair is still in a downtrend. EUR/USD is printing lower peaks and lower troughs below both the 50- and the 200-day moving averages. A clear dip below 1.1260 (S1) is the move that would shift the bias back to the downside, I believe. Such a break could probably pull the trigger for another test of 1.1100 (S2), defined by the low of the 26th of January.
• Support: 1.1260 (S1), 1.1100 (S2), 1.1025 (S3)
• Resistance: 1.1450 (R1), 1.1540 (R2), 1.1650 (R3)
EUR/JPY higher after Greek debt agreement
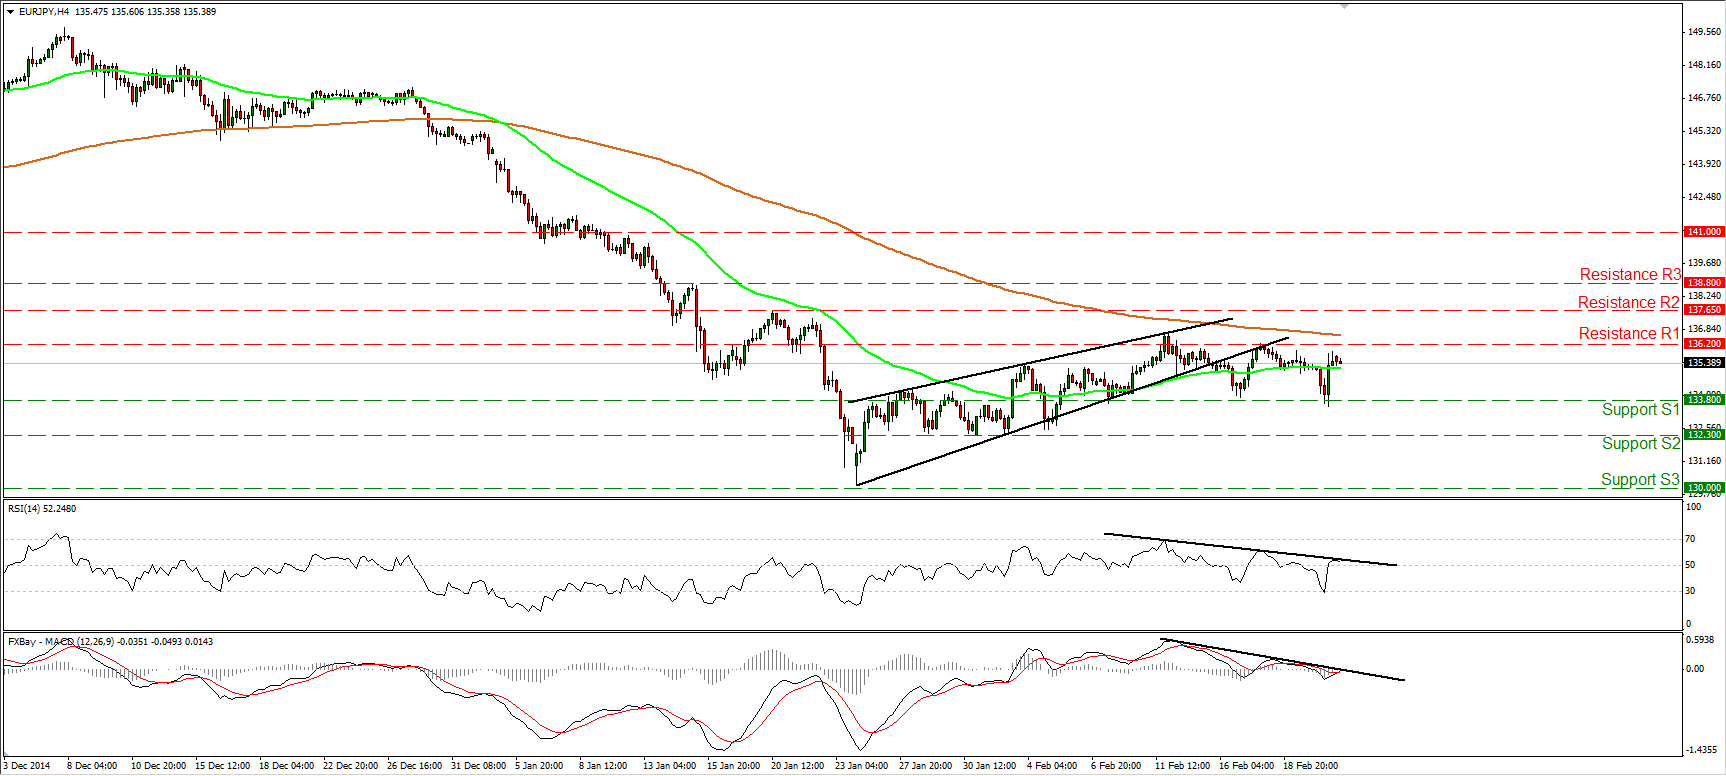
• EUR/JPY rebounded on the Greek debt agreement as well. The pair hit support slightly below the 133.80 (S1), firmed higher, but the move was limited below our resistance of 136.20 (R1). Taking a look at our momentum studies, I would expect the forthcoming wave to be negative, perhaps for another test of the 133.80 (S1) zone. Both the oscillators stay below their respective downside resistance lines, with the RSI hitting resistance at its line and turning down. If the bears are strong enough to drive the battle below the 133.80 (S1) area, I would expect them to challenge the next obstacle at 132.30 (S2).On the daily chart, we see that the strong recovery from 130.00 remained limited near the 38.2% retracement level of the 29th of December – 26th of January plunge. Hence, I would still see that recovery as a corrective phase.
• Support: 133.80 (S1), 132.30 (S2), 130.00 (S3)
• Resistance: 136.20 (R1), 137.65 (R2), 139.35 (R3)
GBP/USD breaks the lower line of a wedge
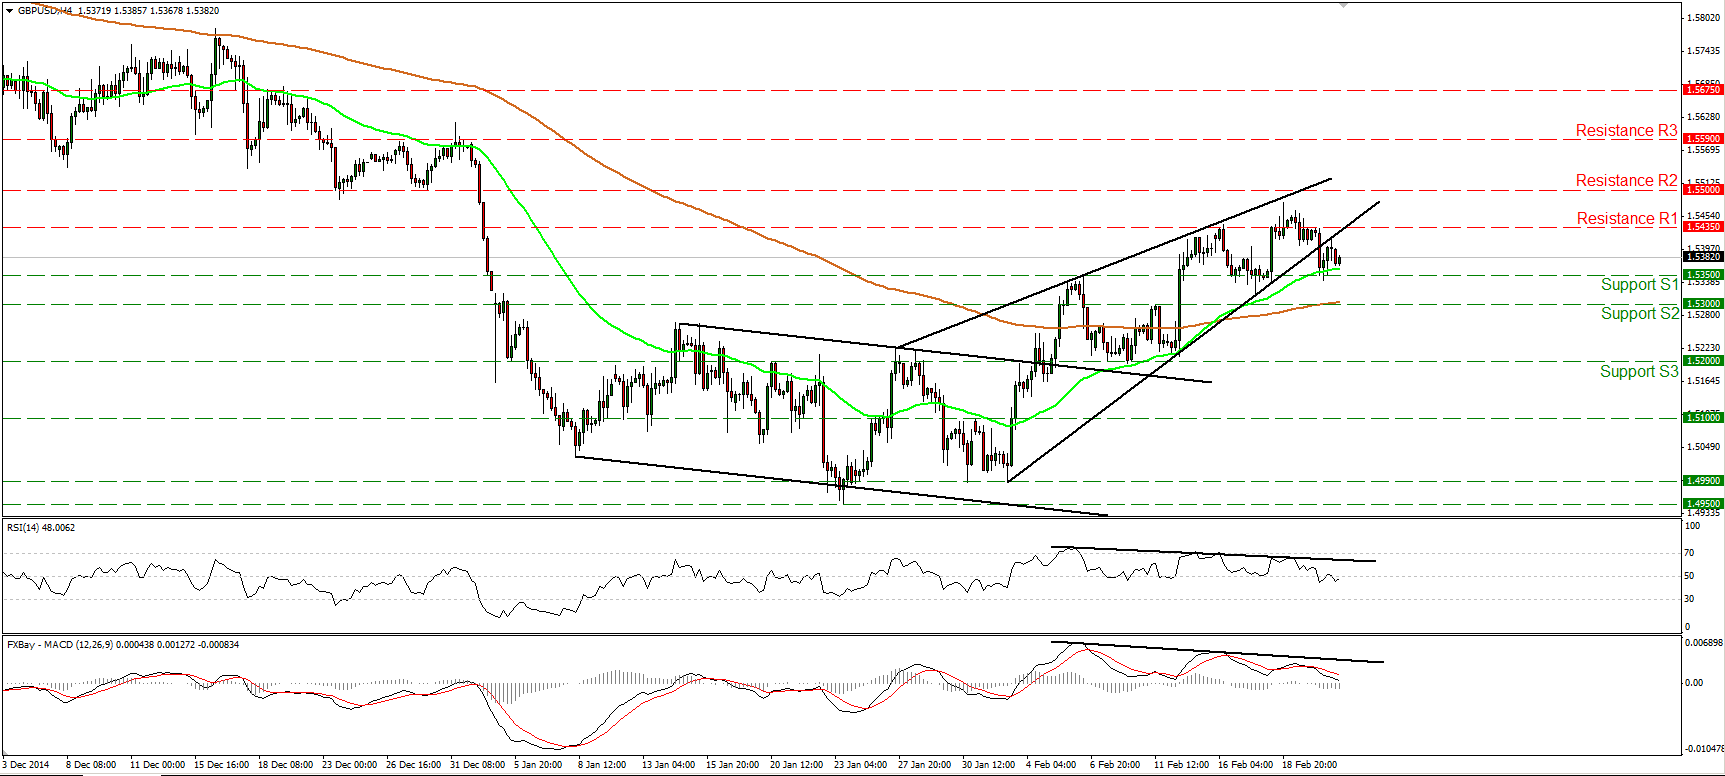
• GBP/USD dipped below the lower bound of a rising wedge formation that had been containing the price action since the 27th of January. The fall came after the greater-than-anticipated decline in the UK retail sales for January, and confirmed the negative divergence between both our short-term oscillators and the price action. The rate hit support near the 1.5350 (S1) barrier, where a clear break may prompt extensions towards the next obstacle at 1.5300 (S2). As for the broader trend, as long as Cable is trading below the 80-day exponential moving average, I would consider the overall downtrend to be intact and I would see the recovery from 1.4950 as a corrective phase. It is worth noting that currently the 80-day EMA coincides with the 1.5500 (R2) psychological area. As a result, only a clear close above that zone could have larger bullish implications, and make me argue for a possible trend reversal.
• Support: 1.5350 (S1), 1.5300 (S2), 1.5200 (S3)
• Resistance: 1.5435 (R1), 1.5500 (R2), 1.5590 (R3)
Gold hits again the psychological zone of 1200
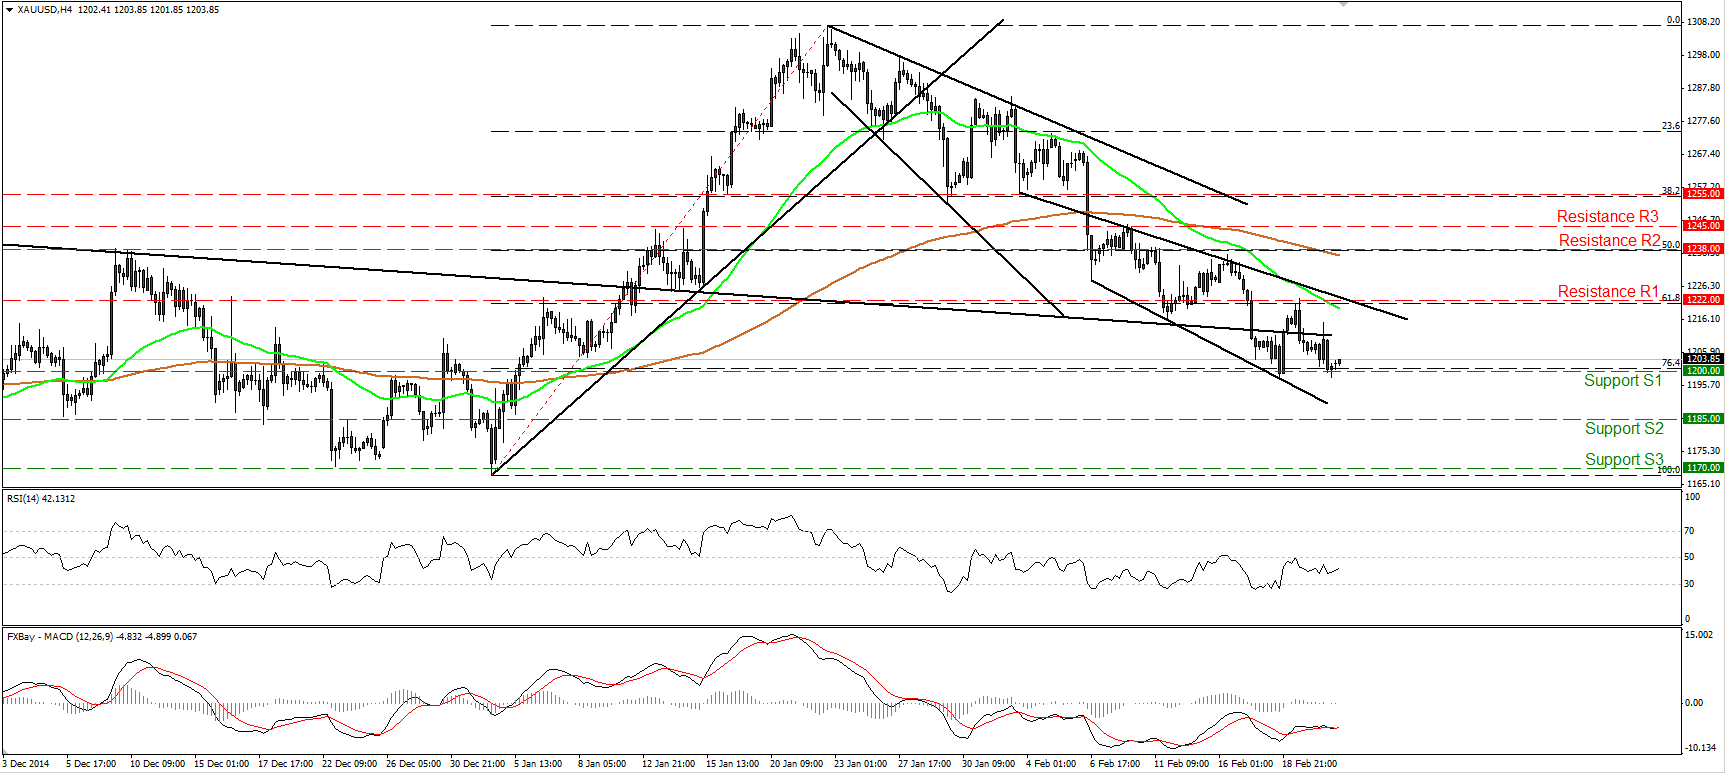
• Gold continued its slide on Friday to reach again the psychological line of 1200 (S1), which stands close to the 76.4% retracement level of the 2nd – 22nd of January advance. The price structure on the 4-hour chart still suggests a near-term downtrend and therefore, I would expect a clear and decisive dip below that round figure to set the stage for extensions towards the 1185 (S2) support territory. On the daily chart, the move below the neckline of the inverted head and shoulders completed on the 12th of January erased the hopes of the bulls for a rebound near the neckline and strengthened the likelihood for further declines.
• Support: 1200 (S1), 1185 (S2), 1170 (S3)
• Resistance: 1222 (R1), 1238 (R2), 1245 (R3)
WTI tumbles but stays above 50.00
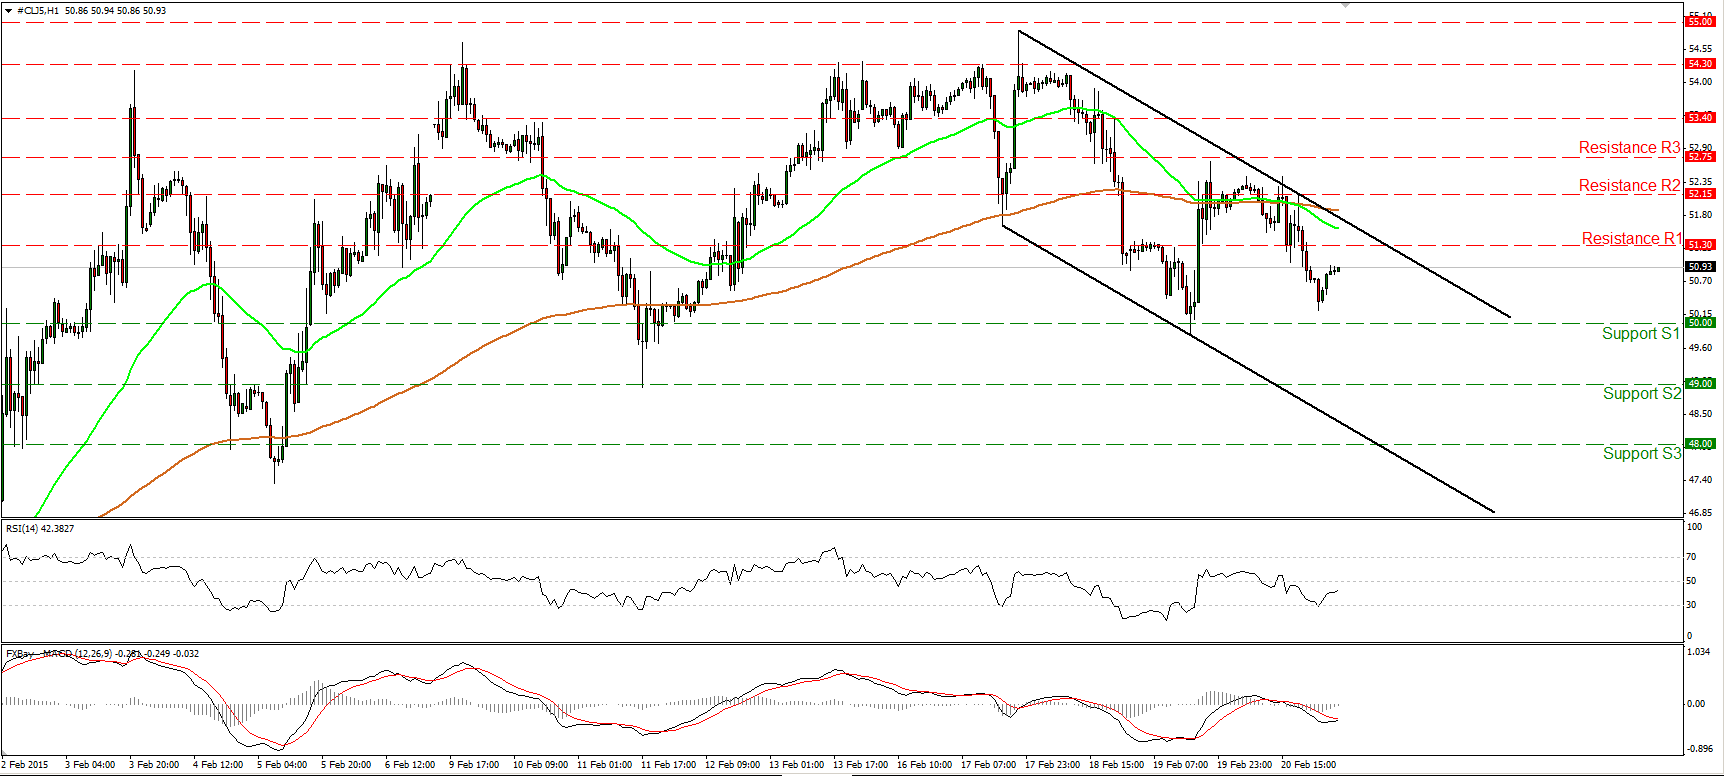
• WTI tumbled on Friday, but the fall stayed limited to 20 cents above the psychological area of 50.00 (S1). The price structure on the 1-hour chart remains one of lower highs and lower lows within the black downside channel, but I would prefer to see a clear move below the 50.00 (S1) round number before getting more confident on the downside. On the daily chart, WTI is still trading below both the 50- and the 200-day moving averages. Moreover, the 14-day RSI turned down and fell below its 50 line, while the daily MACD has topped and appears able to move below both its zero and signal lines in the near future. These signs show that the momentum is getting negative again and magnify the case for further declines, at least in the short run.
• Support: 50.00 (S1), 49.00 (S2), 48.00 (S3)
• Resistance: 53.30 (R1) 52.15 (R2), 52.75 (R3)

