On last Friday I needed to make a choice between IBM (IBM) and Teva Pharmaceuticals (TEVA). I decided to pick the technology stock despite the fact the IBM has a higher valuation in terms of price to earnings and debt to equity ratio.
The current valuation of IBM is 14.23 and the forward P/E is at 11.25. Also the dividend yield is the lowest below all portfolio holdings. It’s at 1.84 percent. Why buying IBM?
Compared to other high quality dividend growth stocks, IBM is still cheap like most other technology companies with a higher capitalization. IBM is the biggest basic pick within the sector and every long-term dividend growth investor need some shares of the company. As of now, I had no shares of the company and needed to pull the trigger for the first position.
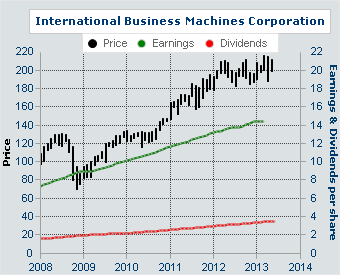
The second reason to take a stake of IBM is the low cyclic and higher degree of safeness. With a $200+ billion company, you have much more possibilities to grow and the self finance ratio is also much higher. IBM makes huge share buybacks while TEVA needs to increase its capital basis. As you might see below, the dividend potenital compared to earnings per share is for IBM unbelievable high.
What makes IBM?
International Business Machines Corporation provides information technology (IT) products and services worldwide. The company operates in five segments: Global Technology Services, Global Business Services, Software, Systems and Technology, and Global Financing. The Global Technology Services segment provides IT infrastructure and business process services, including strategic outsourcing, process, integrated technology, and technology support services.
How many shares?
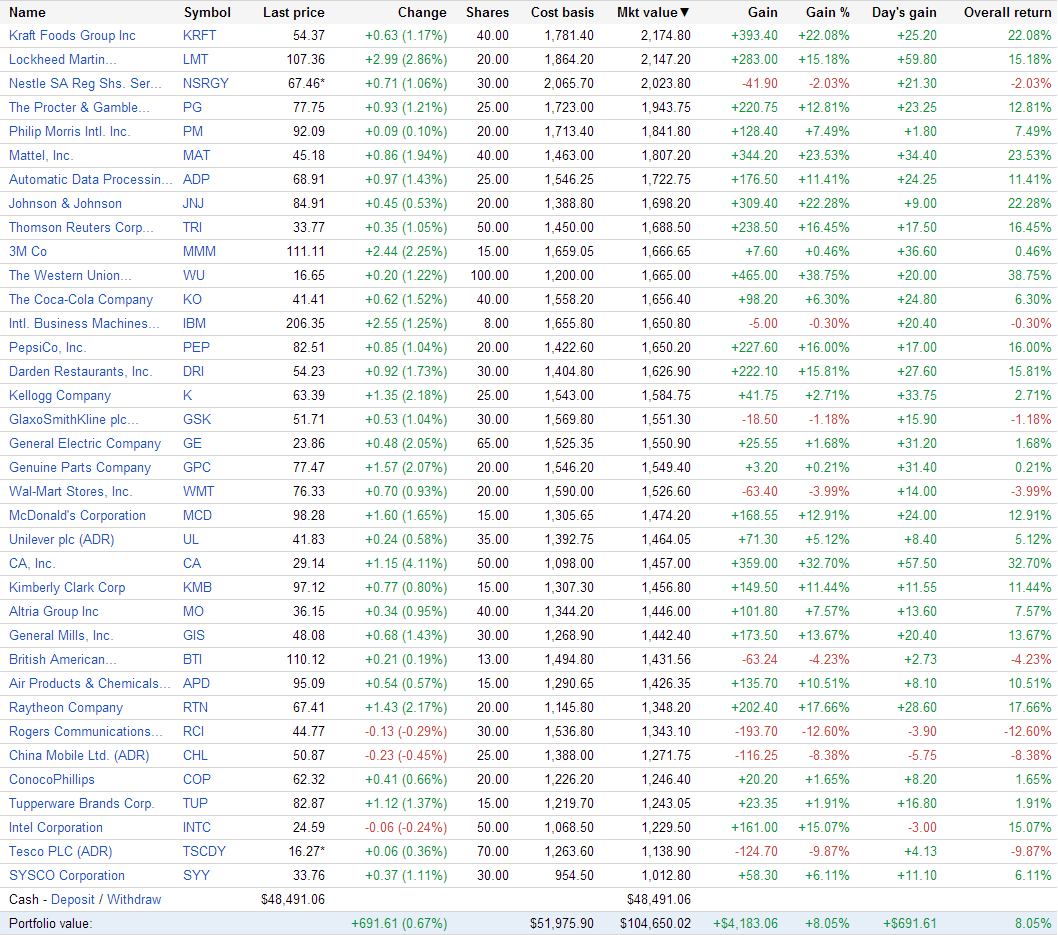
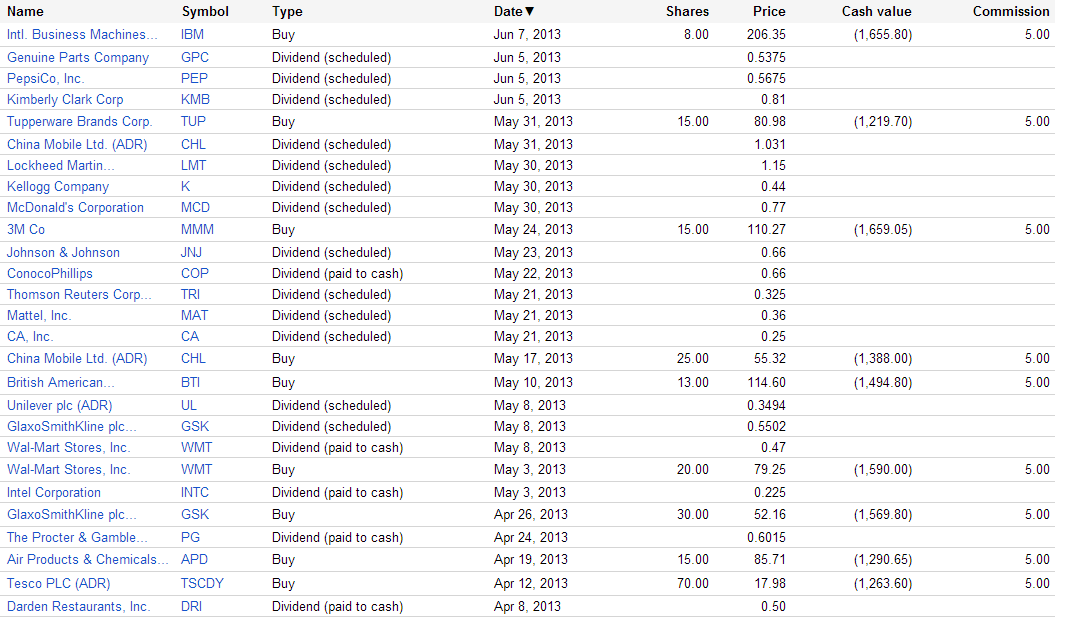
I purchased 8 shares at 206.35 which resulted in a total purchase amount of $1,650.80. IBM is the thirteenth biggest stake in my Dividend Yield Passive Income Portfolio (DYPI).

The DYP-Portfolio was funded virtual on October 03, 2012 with 100k. Since then, I purchased each week one stake for around 1k to 2k. Now, I still have $48.491.06 and 35 portfolio holdings.
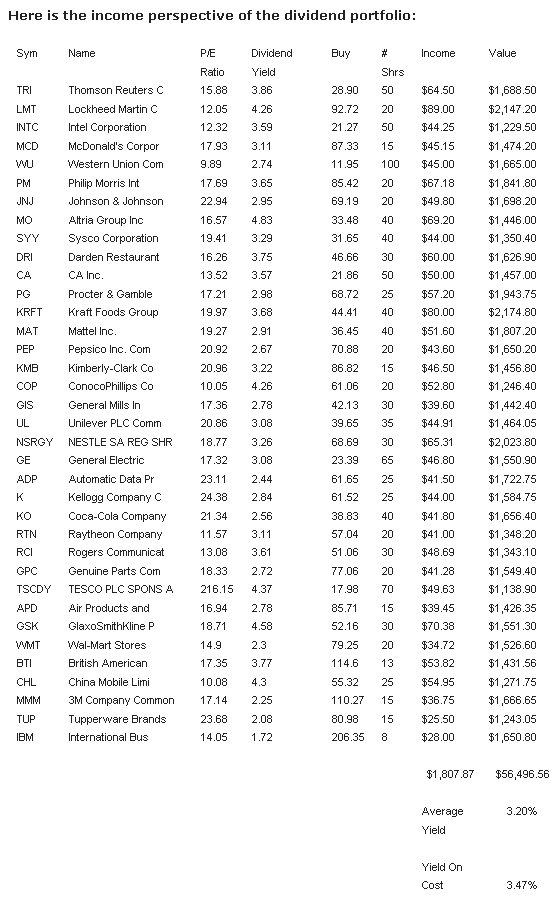
The full portfolio income is now estimated at $1,807 per year. The average portfolio yield on cost amounts to 3.47 percent and the current yield of the portfolio is 3.20 percent.
- English (UK)
- English (India)
- English (Canada)
- English (Australia)
- English (South Africa)
- English (Philippines)
- English (Nigeria)
- Deutsch
- Español (España)
- Español (México)
- Français
- Italiano
- Nederlands
- Português (Portugal)
- Polski
- Português (Brasil)
- Русский
- Türkçe
- العربية
- Ελληνικά
- Svenska
- Suomi
- עברית
- 日本語
- 한국어
- 简体中文
- 繁體中文
- Bahasa Indonesia
- Bahasa Melayu
- ไทย
- Tiếng Việt
- हिंदी
International Business Machines: Next Portfolio Stock Purchase
Published 06/10/2013, 02:12 AM
Updated 07/09/2023, 06:31 AM
International Business Machines: Next Portfolio Stock Purchase
3rd party Ad. Not an offer or recommendation by Investing.com. See disclosure here or
remove ads
.
Latest comments
Install Our App
Risk Disclosure: Trading in financial instruments and/or cryptocurrencies involves high risks including the risk of losing some, or all, of your investment amount, and may not be suitable for all investors. Prices of cryptocurrencies are extremely volatile and may be affected by external factors such as financial, regulatory or political events. Trading on margin increases the financial risks.
Before deciding to trade in financial instrument or cryptocurrencies you should be fully informed of the risks and costs associated with trading the financial markets, carefully consider your investment objectives, level of experience, and risk appetite, and seek professional advice where needed.
Fusion Media would like to remind you that the data contained in this website is not necessarily real-time nor accurate. The data and prices on the website are not necessarily provided by any market or exchange, but may be provided by market makers, and so prices may not be accurate and may differ from the actual price at any given market, meaning prices are indicative and not appropriate for trading purposes. Fusion Media and any provider of the data contained in this website will not accept liability for any loss or damage as a result of your trading, or your reliance on the information contained within this website.
It is prohibited to use, store, reproduce, display, modify, transmit or distribute the data contained in this website without the explicit prior written permission of Fusion Media and/or the data provider. All intellectual property rights are reserved by the providers and/or the exchange providing the data contained in this website.
Fusion Media may be compensated by the advertisers that appear on the website, based on your interaction with the advertisements or advertisers.
© 2007-2024 - Fusion Media Limited. All Rights Reserved.
