
Most of the major indices across the globe closed in negative territory yesterday, apart from the S&P 500 and NASDAQ. In terms of good economic data, yesterday, the US initial jobless claims finally managed to beat its forecast and came out at 348k against the 363k, which was initially expected. During the European morning, Britain delivered its core and headline retail sales number for the month of July, on a MoM and YoY basis.
Indices Continue To Slide
Most of the major indices across the globe closed in negative territory yesterday, apart from the S&P 500 and NASDAQ. At the beginning of their trading session, the US indices moved lower, as fears over the Fed potentially tapering the stimulus program at the end of the year, grew larger. Market participants are worried that the reason the US economy seems to be performing well right, despite all the Covid-related issues, is because investors know that they have Fed’s support, which may continue helping boosting the economy. However, as we all know, that support is not meant to last forever and the market will have to adjust to that eventually. The question here is, how painful would the cost of that adjustment be? The recent decline, which we are seeing in equities, for now, might be considered as a temporary correction, before another possible upmove.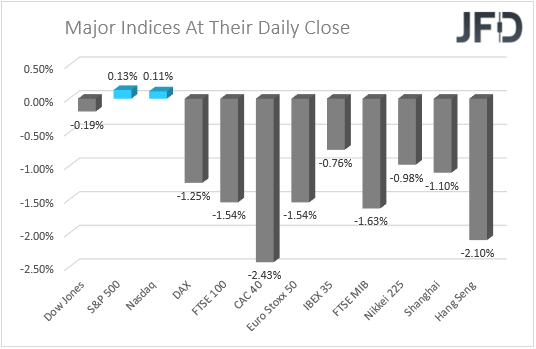
DJIA Technical Outlook
Despite declining heavily this week, the DJIA index continues to trade above a medium-term tentative upside support line taken from the low of Jan. 31. Even if the price slides a bit further south, as long as that upside line continues to provide support, we will remain positive, at least with the near-term outlook.
A small push lower might bring the index closer to the aforementioned upside line, which if remains intact, could attract the buyers back into the game. DJIA may then travel to the 35028 obstacle, or to the 35354 zone again. That zone is marked by the inside swing low of Aug. 12 and the high of Aug. 18.
Alternatively, if the previously mentioned upside line breaks and the price falls below the 34476 hurdle, marked by the low of July 21, that might clear the way to some lower areas, as some bulls could get spooked from the field. DJIA may then drift to the 34250 obstacle, a break of which could set the stage for a move to the 33960 hurdle, marked by the low of July 20. If the slide continues, the next possible target could be the lowest point of July, at 33739.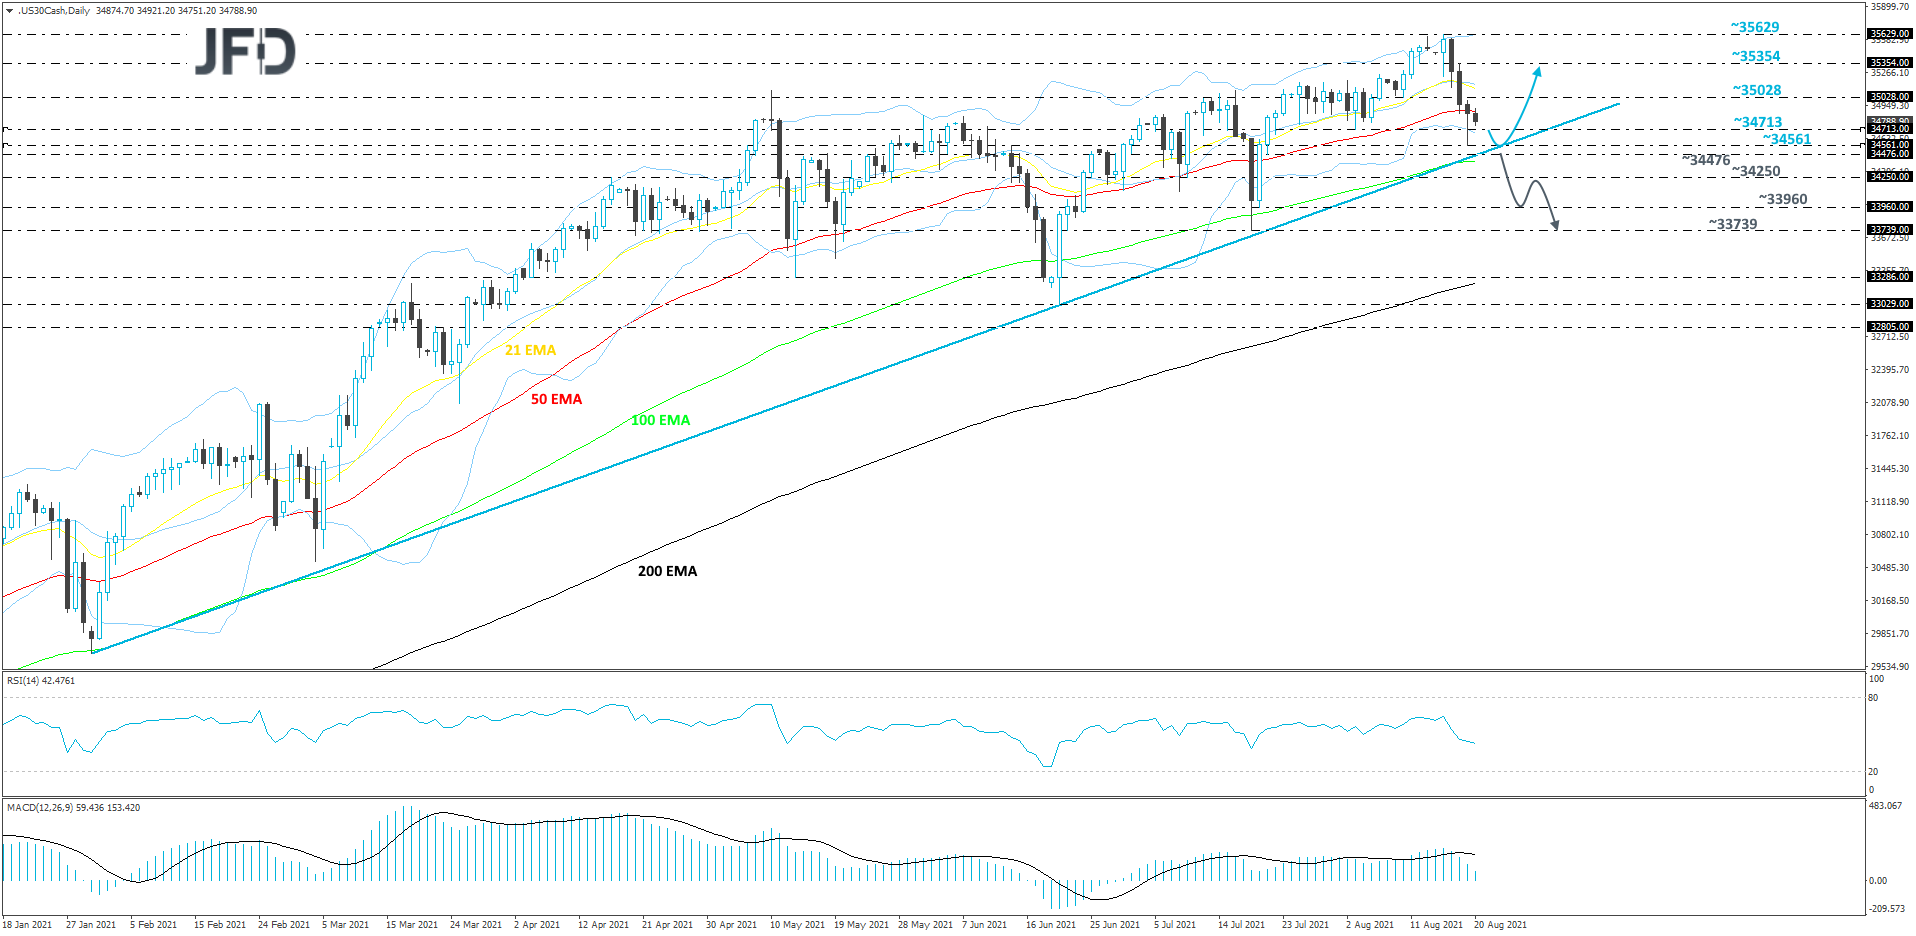
US Initial And Continuing Jobless Claims
In terms of good economic data, yesterday, the US initial jobless claims finally managed to beat its forecast and came out at 348k against the 363k, which was initially expected. This kept slight positivity in the market, not allowing the US indices to sell off too much. But good news was not coming from the US continuing jobless claims indicator, that came out at 2820k, showing a slightly increase from the initially forecasted 2800k figure. The fact that there are still plenty of people continuing to claim unemployment benefits and it seems that the country is struggling to get back to pre-pandemic numbers.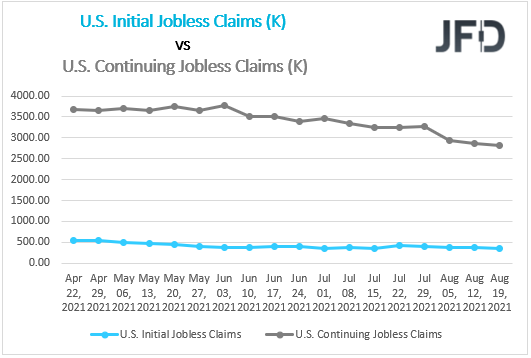
In terms of today’s economic data, during the Asian session we have received China’s PBoC loan prime rate. There was no initial expectation, but the figure remained the same as previous, at +3.85%. Last time the rate changed was back in April 2020.
During the European morning, Britain delivered its core and headline retail sales number for the month of July, on a MoM and YoY basis. Initially, the numbers were expected to decline from their previous readings, but the actual figures showed up even lower than their initial forecasts. For example, the core YoY figure was expected to appear somewhere near the +5.7% mark, whereas the actual reading showed up at +1.8%. The headline one was believed to appear around the +6.0%, but showed up at +2.4%. The British pound did not react much to the news.
GBP/JPY Technical Outlook
GBP/JPY continues to its journey south, while trading below a short-term tentative downside resistance line taken from the high of Aug. 12. Even if, at some point, we see a reversal back to the upside, if that downside line continues to provide resistance, we will remain bearish, at least for now.
If the 149.29 territory, marked by the low of July 21, continues to provide support, there could be a slight reversal back to the upside. That said, if GBP/JPY remains somewhere below the aforementioned downside line, the bears might take advantage of the higher rate and push it south again. If this time the pair moves strongly below the 149.29 zone, this might clear the way towards the 148.99 obstacle, or even to the 148.46 level, marked by the lowest point of July.
On the upside, if the pair breaks the previously discussed downside line and then pushes through the 150.27 barrier, marked by the low of Aug. 17, that could attract more buyers into the game. GBP/JPY may rise to the 150.85 obstacle, a break of which might set the stage for a move to the 151.40 level, which is the high of Aug. 18.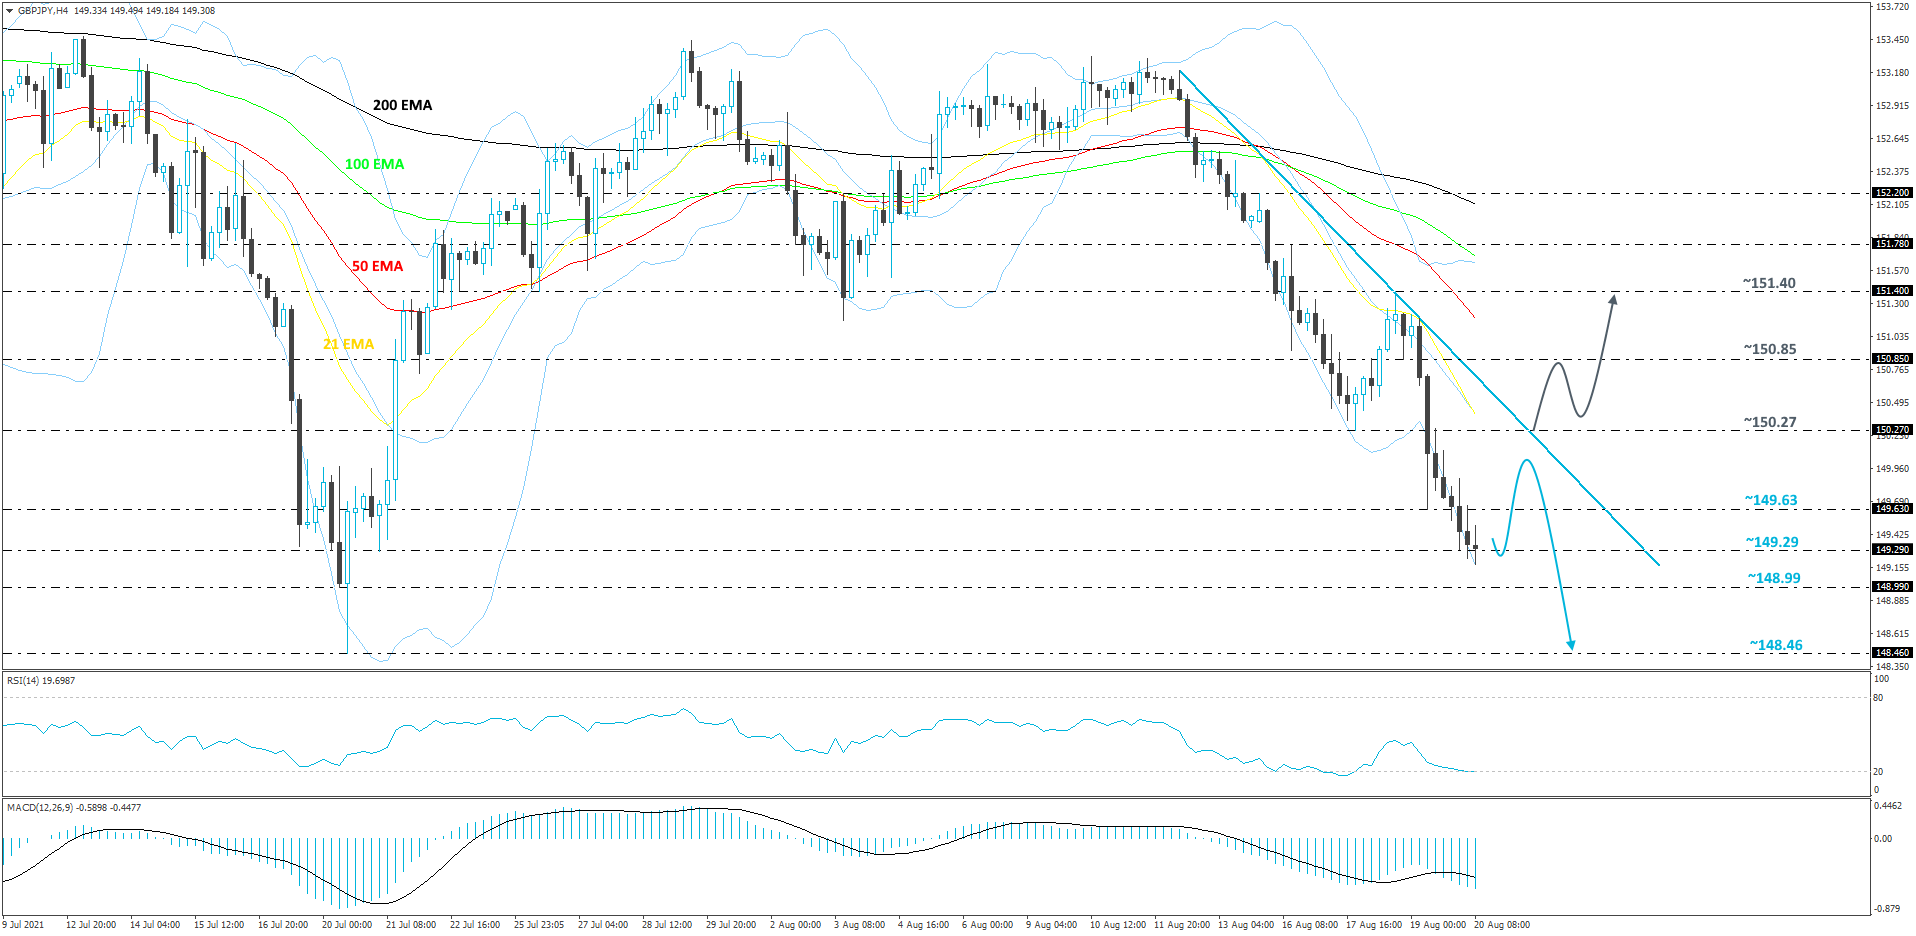
As For The Rest Of Today’s Events
Later on in the day, Canada is also expected to release its retail sales numbers, but for June instead, and only on a MoM basis. The core figure is believed to have improved significantly, going from -2.0% to +4.4%. The headline one is expected to rise from -2.1% to +4.4%. If the actual readings show up even better than the forecast, this may help stabilise the declining CAD, which has been under bearish pressure due to falling oil prices.