Across the investment cycle, every index composite is adjusted to reflect institutional interests. This always generates problems when comparing portfolio performance to any index as the cycle progresses.
The media pressure to compare short-term results vs. the current crop of FANG-type issues being a daily occurrence, gradually shames many institutional investors into buying into the ‘highest fliers.’ Investment committees' thinking that on Modern Portfolio teachings since 1952, that quarter-over-quarter performance should be the benchmark, is unfortunately driven by the media palaver. Missed in the process is the fact that media palaver is designed to increase viewership and in turn advertising revenue. There is no connection between media’s push to generate advertising revenue and long-term returns. Every investor becomes a victim of the consensus!
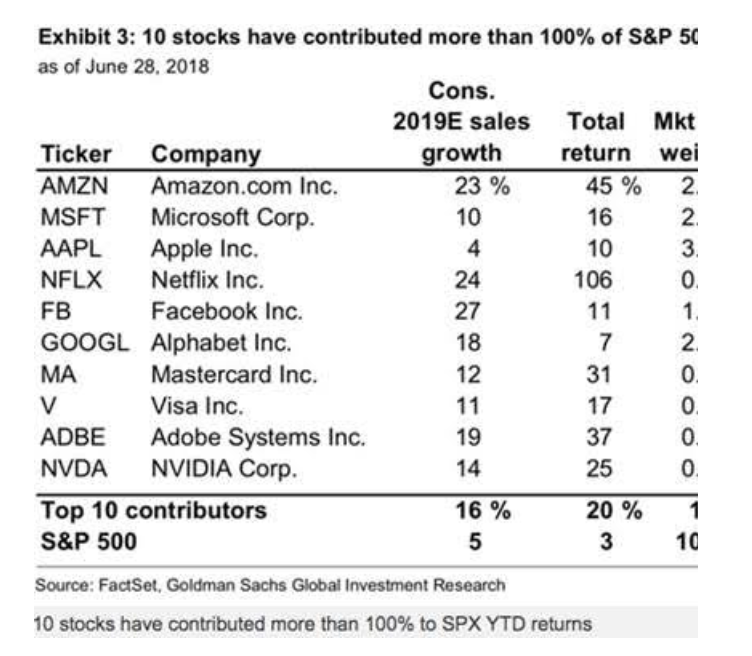
The issue of one’s portfolio performance in comparison to any index always develops later in a cycle as the indices dominated by the FANG-type issues of that cycle. A recent Internet posting is instructive. The headline says it all and Exhibit 3 provides the detail.The S&P 500 long-term history is 6.1%. If we come away with a multiple of that, then we have done well. I want to see 15%+ long-term without investing in any of the FANG-type issues which are pure speculation, not investments. The 15% annual target I use is for a full cycle with us specifically exiting near the cycle peak (as best as we can) and buying 5-yr Treasuries before the market/economy cycles into recession. My 15% target is based on recession low to recession low vs. S&P 500 6.1%.
6 Stocks Accountable For Nearly All The S&P 500’s Gains This Year
By Investing.com (Jesse Cohen/Investing.com)

One cannot compare acct performance or even expect outperformance when the S&P 500 has always been boosted by those few ‘high fliers’ as the cycle progresses. The long-term performance of the issues I suggest are in the range of 15%+. They are selected during low periods and expected to generate somewhat higher returns as they recover market acceptance. But, these are long-term record issues, i.e.,10 years - 25 years+ like KSU, FAST, XOM, GWW, GILD, GIS, BUD and etc. may take 18 months to regain positive market psychology. Having already experienced fairly quick responses from DHR, HEI, MLAB, FTV, CAT, DE and etc., we have already rotated out with decent returns. Predicting when market psychology will suddenly kick any particular issue higher is impossible. The approach I recommend is to buy good management teams at relatively low prices, diversifying,being patient, monitor each carefully and exit when valuation appears excessive.
Part of my investment process is to buy near recession lows and sell as it appears we are coming to a market-cycle peak. I periodically lay this out in my notes. The idea behind this is that corrections are often much more than 20%. It makes investing sense to sell as close to the market peak as we can identify, pay the taxes rather than sit through a correction which is likely to cycle lower than the tax expense, then reenter. The last 2 major corrections were 50%+. We want to use corrections as positive investment experiences. They are investment opportunities to buy 5yr Treasuries which produce decent relative gains during corrections.
Because the S&P 500 always becomes skewed with each cycle’s FANG-type issues, like any index which become infused with these issues, is not a good short-term market performance benchmark. FANG-type issues are valued at 10x+ Revenue, many times Earnings/Share and excessively high multiples of other financial metrics, much like the 1990s Internet issues. I do not recommend these issues. The S&P 500 has performance of ~6% long-term even with FANG-types added if one looks across multiple cycles. Recent S&P 500 2yr performance of 30%+ is skewed by these issues. I suggest individual issues with 15%+ historical performance. But, this is long-term performance and suggested during periods of market pessimism specific to each issue. Any of them can be out of favor for a couple of years before earnings spark improved market psychology. Because the S&P 500 becomes skewed with FANG-type issues, it becomes impossible to use as a short-term performance index against such a portfolio. NFLX, an S&P 500 member, rose more than 100% the last 6 months (Jan 2018 - July 2018). This issue is in “Tulip Mania”!
The Investment Thesis July 30, 2018:
The market cycle appears to have several years left before market-peak signals develop. Common sense tends to go out the window as FANG-type issues dominate the indices. The better long-term investment outcomes come from having a long-term disciplined approach, investing with the best CEOs and managers one can identify and ignore media-hyped performance measures as dangerous to one’s outcome.
The information in this blog post represents my own opinions and does not contain a recommendation for any particular security or investment. I or my affiliates may hold positions or other interests in securities mentioned in the Blog, please see my Disclaimer page for my full disclaimer.