June's AI-picked stock updates now live. See what's new in Tech Titans, up 28.5% year to date.Unlock Stocks

Important Levels To Watch In Gold

Published 11/07/2013, 05:35 PM
Updated 07/09/2023, 06:31 AM
GC
-

Gold has been an interesting asset class this year with many multi-day and -week swings in both directions. This can be either a traders mecca or worst nightmare depending on their paradigm and strategy. Patience can be vital in a quick-moving market.

There are two charts of gold I want to take a look at today. The first one is of the last seven months. The two lows in April and May created resistance that we’ve been unable to clear except for a short period of time in Aug/Sept. On the downside we have a simple trend line connecting the two most recent lows which could act as support if end up breaking $1275.

We also have the long-term trend line going back to 1999 that I mentioned in early October which could act as potential support on any further weakness we see in the gold market. But what I’m watching the closest is the 150-day moving average, which we’ll look at in more detail on the next chart.
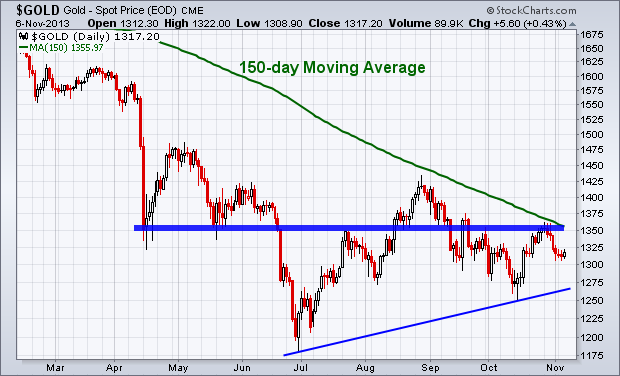
Gold Daily Chart
Below is a chart of gold going back to 2009. The blue line is the 150-day moving average. I’ve put red arrows to better show the past importance of this moving average as support and resistance for the shiny metal. As you can see in the chart above, we have come very close to testing the 150-day MA recently. The risk associated with gold this close to critical resistance just doesn’t interest me. Again, patience is key.
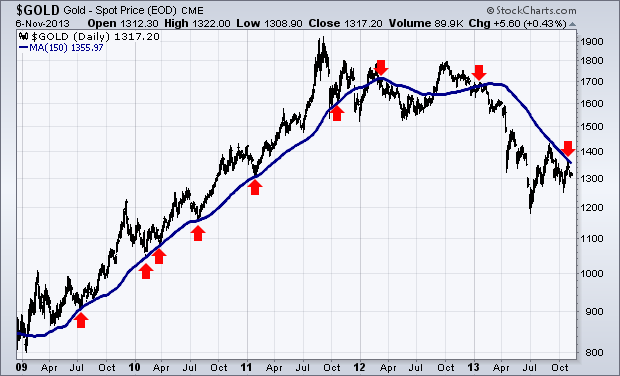
Gold Daily Overview 2009-Present
Disclaimer: Do not construe anything written in this post or this blog in its entirety as a recommendation, research, or an offer to buy or sell any securities. Everything in this post is meant for educational and entertainment purposes only. I or my affiliates may hold positions in securities mentioned in the blog. Please see my Disclosure page for full disclaimer.

Latest comments

Loading next article…
Risk Disclosure: Trading in financial instruments and/or cryptocurrencies involves high risks including the risk of losing some, or all, of your investment amount, and may not be suitable for all investors. Prices of cryptocurrencies are extremely volatile and may be affected by external factors such as financial, regulatory or political events. Trading on margin increases the financial risks.
Before deciding to trade in financial instrument or cryptocurrencies you should be fully informed of the risks and costs associated with trading the financial markets, carefully consider your investment objectives, level of experience, and risk appetite, and seek professional advice where needed.
Fusion Media would like to remind you that the data contained in this website is not necessarily real-time nor accurate. The data and prices on the website are not necessarily provided by any market or exchange, but may be provided by market makers, and so prices may not be accurate and may differ from the actual price at any given market, meaning prices are indicative and not appropriate for trading purposes. Fusion Media and any provider of the data contained in this website will not accept liability for any loss or damage as a result of your trading, or your reliance on the information contained within this website.
It is prohibited to use, store, reproduce, display, modify, transmit or distribute the data contained in this website without the explicit prior written permission of Fusion Media and/or the data provider. All intellectual property rights are reserved by the providers and/or the exchange providing the data contained in this website.
Fusion Media may be compensated by the advertisers that appear on the website, based on your interaction with the advertisements or advertisers.
© 2007-2024 - Fusion Media Limited. All Rights Reserved.