
Yesterday we discussed the potential economic ramifications of declining exports on domestic businesses and employment. The recent releases of import and export prices, along with wholesale trade data, add further confirmation that the economy is slowing.
In the last update on these prices we said: "The chart of negative net export prices shows the continued problem. Historically, when exports go negative it has typically been associated with a recession. With the initial economic support driven by the housing bubble from 2004-2007, even as net exports went negative, the economy was able to hold together for a longer than expected period. Today, with continued interventions by the Fed, and the Administration, the economy is once again bucking the trend of negative net exports - the only question is sustainability? Furthermore, import prices are now down for a third month in a row, falling a very steep 2.7% in June following a downwardly revised 1.2% plunge in May and a 0.1% decline in April. This is the first time since the last recession that this has occurred."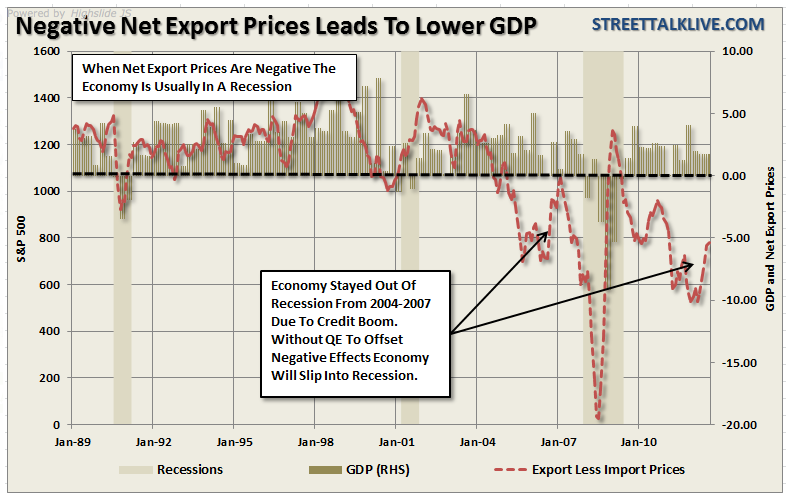
The bounce in net export prices came from a strengthening of the U.S. Dollar in August, which has now faded. However, it is important to notice that just before the last recession negative net exports improved sharply just prior to. This increase in export prices is being driven by the drought in the MidWest which pushed agricultural products higher by 5.1% in August following July's 6.3% surge. The concerns over shortages is driving prices of the foods/feeds/beverages component up 4.8% and 6.8% in the last two readings. This, however, is a temporary anomaly, which will subside as we move into the winter months.
More concerning are import prices which have now declined on an annualized basis for four-months in a row. In the latest month energy related gains masked the still declining trends for many import prices. Import prices excluding petroleum fell 0.2% in August, which is a fourth straight decline. Prices of imported finished goods continue to edge downward with consumer goods down 0.3% for a third straight decline and capital goods down 0.1% for the fourth decline in five months. These are the weakest readings of the recovery and point to a lack of pricing power for producers.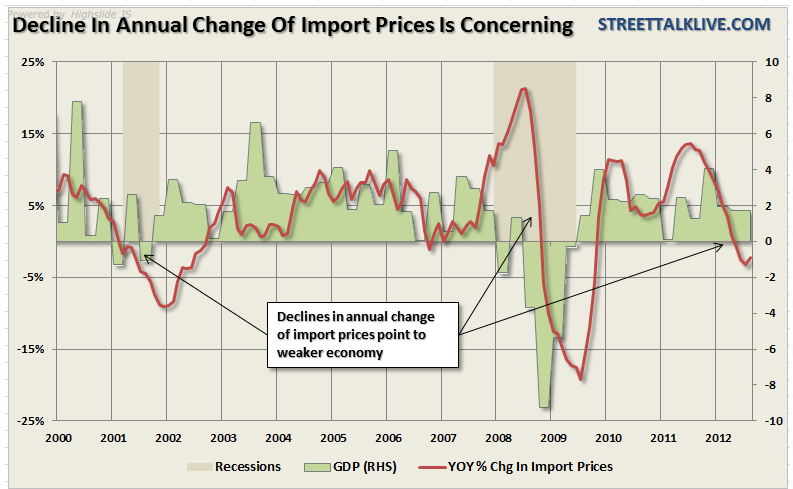
Overall, like the majority of the other economic-related reports as of late, the news is not good for the economy, or the markets, in the near term.
Wholesale Trade
The wholesale-trade data, as well as the inventory to sales ratio, showed the weakness on the consumption side of the economic equation. For the latest month sales fell almost 0.1% and have declined by more than 50% since this past April. This data clearly lines up with the trends that we have seen in earnings and revenue for corporations. Our argument for quite some time has been that the profit margin expansions we have witnessed since the last recession are ephemeral as they have been driven by cost cutting and low employment. We discussed this in our article "Corporate Profits Surge At Workers Expense" where in we stated: "'Given the enduring hard times, you might think that corporations have used up their cash since 2009. But real pretax corporate profits have soared, from less than $1.5 trillion in 2009 to $1.9 trillion in 2010 and almost $2 trillion in 2011, data from the federal Bureau of Economic Analysis shows.'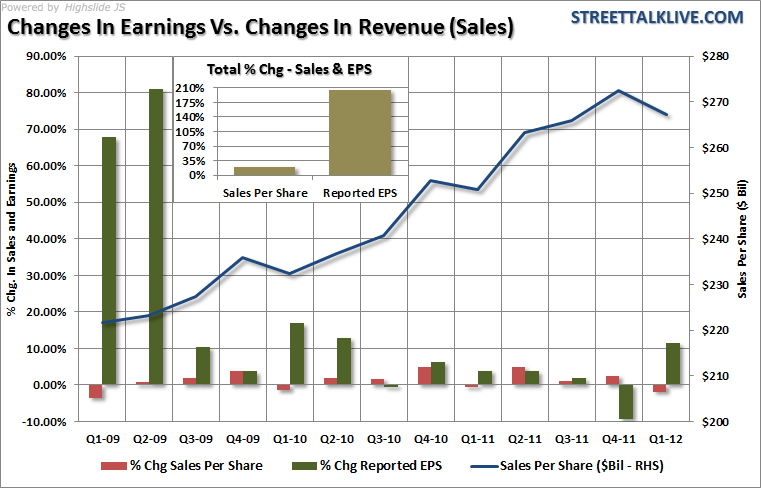
There is a very interesting, albeit disturbing, contradiction in the statement above. The initial assumption would be that if companies are having a hard time putting cash to work, because there is less demand for products and services, this would infer lower revenues. The chart shows the change in reporting earnings and sales (top line revenue) for the S&P 500. Since the beginning of 2009 the total growth in sales per share has been 21% as compared to a 206% increase in reported earnings. This confirms our assumption that lower revenues and demand is behind the historically high levels of corporate 'cash hoarding.' However, if revenue growth is weak then how are real pretax corporate profits soaring? The answer comes down cost controls and productivity."
Inventories Up
More importantly, the slow down in sales (consumption) has led to an unwanted rise in inventories of 5.41% annually. Increases in inventories are troubling as ultimately producers will become more defensive by liquidating excesses, idling back production and reducing employment. This obviously does not bode well for either GDP growth, or employment, in the future. This data confirms the recent slate of manufacturing reports, which have shown a decline in new orders and backlogs with increases in inventories. The decline in consumption is something that we have been warning about for the past several months as the negative trends in the incoming data have picked up.
The chart shows the annual change in sales, inventories and the inventory to sales ratio. With the inventory to sales ratio rising towards historical peaks (excluding the financial crisis), combined with the sharp slow down in sales, we are likely going to see continued weakness in upcoming manufacturing reports.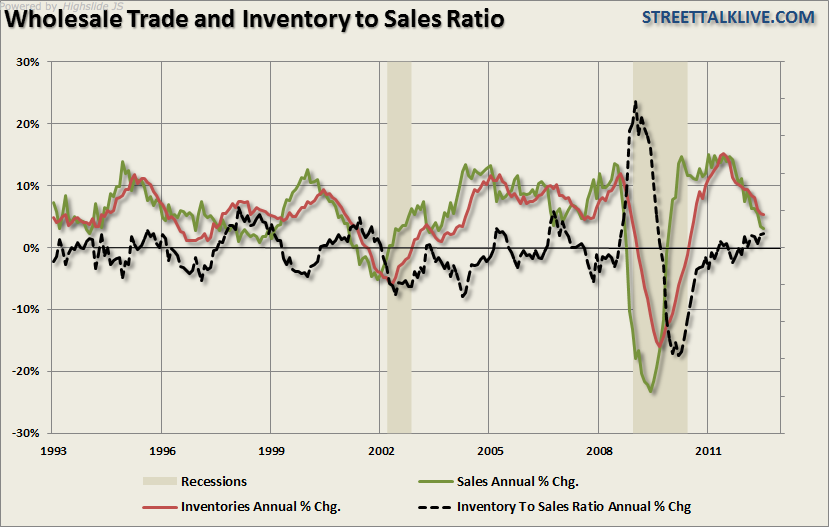
While the evidence is clearly tilted toward economic weakness -- we are still not at recessionary levels just yet with respect to wholesale trade (inventories and sales annual change will go below 0%). However, as I have been discussing over the last several months -- the likelihood is mounting that the Fed will act with further "balance sheet expansion" programs before a recession sets in. However, with the markets up strongly for the year, the ECB engaged in its latest bond buying scheme, and interest rates already near their lows, I don't expect to see further stimulative action until the further weakness sets in.
With the markets grossly overbought on an intermediate term basis, and driven by "hope" rather than improving fundamentals, as discussed yesterday, we continue to recommend remaining underweight equities and overweight fixed income and cash at the current time. We discussed extensively our current allocation model, risk and reward calculations and points to add equity risk exposure in this past weekend's newsletter. We are on short term buy signals but buying into an overstretched, "hope driven," rally generally does not work out well.
- English (UK)
- English (India)
- English (Canada)
- English (Australia)
- English (South Africa)
- English (Philippines)
- English (Nigeria)
- Deutsch
- Español (España)
- Español (México)
- Français
- Italiano
- Nederlands
- Português (Portugal)
- Polski
- Português (Brasil)
- Русский
- Türkçe
- العربية
- Ελληνικά
- Svenska
- Suomi
- עברית
- 日本語
- 한국어
- 简体中文
- 繁體中文
- Bahasa Indonesia
- Bahasa Melayu
- ไทย
- Tiếng Việt
- हिंदी
Import-Export: Weakness Persists
Published 09/12/2012, 01:27 PM
Updated 02/15/2024, 03:10 AM
Import-Export: Weakness Persists
3rd party Ad. Not an offer or recommendation by Investing.com. See disclosure here or
remove ads
.
Latest comments
Install Our App
Risk Disclosure: Trading in financial instruments and/or cryptocurrencies involves high risks including the risk of losing some, or all, of your investment amount, and may not be suitable for all investors. Prices of cryptocurrencies are extremely volatile and may be affected by external factors such as financial, regulatory or political events. Trading on margin increases the financial risks.
Before deciding to trade in financial instrument or cryptocurrencies you should be fully informed of the risks and costs associated with trading the financial markets, carefully consider your investment objectives, level of experience, and risk appetite, and seek professional advice where needed.
Fusion Media would like to remind you that the data contained in this website is not necessarily real-time nor accurate. The data and prices on the website are not necessarily provided by any market or exchange, but may be provided by market makers, and so prices may not be accurate and may differ from the actual price at any given market, meaning prices are indicative and not appropriate for trading purposes. Fusion Media and any provider of the data contained in this website will not accept liability for any loss or damage as a result of your trading, or your reliance on the information contained within this website.
It is prohibited to use, store, reproduce, display, modify, transmit or distribute the data contained in this website without the explicit prior written permission of Fusion Media and/or the data provider. All intellectual property rights are reserved by the providers and/or the exchange providing the data contained in this website.
Fusion Media may be compensated by the advertisers that appear on the website, based on your interaction with the advertisements or advertisers.
© 2007-2024 - Fusion Media Limited. All Rights Reserved.