
If history is any guide, either a big or an enormous decline awaits gold stock prices. That’s very bearish for the precious metals market.
Here Comes the Replay
Let’s not forget about the forest while looking at individual trees. By that, I mean looking at how gold stocks perform relative to gold. That’s one of the major indications that the current situation is just like what we saw at the 2012 top.

The situation in the gold stock to gold ratio is similar to what we saw in late 2012 and early 2013. The ARCA Gold BUGS to gold ratio invalidated its first attempt to break lower (marked with red, dashed lines), but after a corrective upswing, it then broke lower more decisively. That’s what I marked using black dashed lines.
If history is to rhyme, we will see a profound decline.
Also, please note that the pattern that we currently see, which started in early 2016, is somewhat similar to what happened between 2003 and 2008.
Back in 2008, the breakdown from the consolidation resulted in sharply lower ratio values and much lower prices of gold stocks.
So, if the situation is analogous to 2012-2013, we’re likely to see a big decline in the following weeks/months, and if it’s analogous to 2008, we’re likely to see an enormous decline in the following weeks/months.
Declining stock prices would only add fuel to the bearish fire (after all, gold stocks are… stocks), and that’s exactly what’s likely to happen.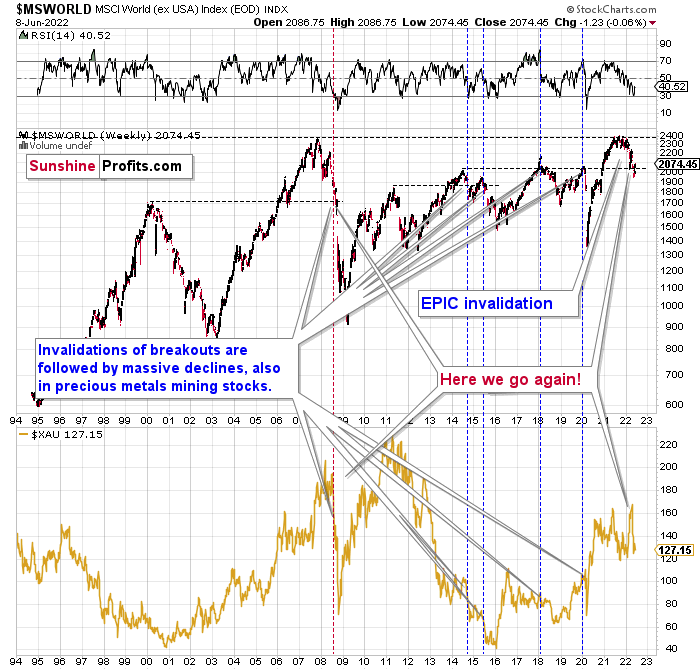
The Bearish Outlook for Precious Metals
The technical picture in the case of world stocks remains extremely bearish, and my previous comments on it were just confirmed. Here’s what I’ve been writing about the above chart for quite a few weeks now:
World stocks have already begun their decline, and based on the analogy to the previous invalidations, the decline is not likely to be small. In fact, it’s likely to be huge.
For context, I explained the ominous implications on Nov. 30. I wrote:
Something truly epic is happening in this chart. Namely, world stocks tried to soar above their 2007 high they managed to do so, and… failed to hold the ground. Despite a few attempts, the breakout was invalidated. Given that there were a few attempts and that the previous high was the all-time high (so it doesn’t get more important than that), the invalidation is a truly critical development.
It's a strong sell signal for the medium - and quite possibly for the long term.
From our – precious metals investors’ and traders’ – point of view, this is also of critical importance. All previous important invalidations of breakouts in world stocks were followed by massive declines in mining stocks (represented by the XAU Index).
Two of the four similar cases are the 2008 and 2020 declines. In all cases, the declines were huge, and the only reason why they appear “moderate” in the lower part of the above chart is that it has a “linear” and not a “logarithmic” scale. You probably still remember how significant and painful (if you were long, that is) the decline at the beginning of 2020 was.
Now, all those invalidations triggered big declines in the mining stocks, and we have “the mother of all stock market invalidations” at the moment, so the implications are not only bearish, but extremely bearish.
World stocks have declined below their recent highs, and when something similar happened in 2008, it meant that both stocks and gold and silver mining stocks (lower part of the chart) were about to slide much further.
The medium-term implications for mining stocks are extremely bearish.
Let’s take a look at the U.S. stock market.

Stocks verified their breakdown below the Q1 2022 low, and then they declined. They broke below the May low, and they corrected a bit after the rate hike announcement, but they didn’t invalidate the breakdown. This means that the breakdown is almost fully confirmed.
The S&P 500 is unlikely to fall below 3,700 this week due to specific positioning in the options market, but it may do so next week.
A weekly close below the May lows would be a very bearish indication for the following days and weeks, and as investors have more time to digest this critical information, their willingness to sell in the following week would likely grow.
The implications for the precious metals market, especially for silver and mining stocks, are very bearish.
* * * * *
All essays, research and information found above represent analyses and opinions of Przemyslaw Radomski, CFA and Sunshine Profits' associates only. As such, it may prove wrong and be subject to change without notice. Opinions and analyses are based on data available to authors of respective essays at the time of writing. Although the information provided above is based on careful research and sources that are deemed to be accurate, Przemyslaw Radomski, CFA and his associates do not guarantee the accuracy or thoroughness of the data or information reported. The opinions published above are neither an offer nor a recommendation to purchase or sell any securities. Mr. Radomski is not a Registered Securities Advisor. By reading Przemyslaw Radomski's, CFA reports you fully agree that he will not be held responsible or liable for any decisions you make regarding any information provided in these reports. Investing, trading and speculation in any financial markets may involve high risk of loss. Przemyslaw Radomski, CFA, Sunshine Profits' employees and affiliates as well as members of their families may have a short or long position in any securities, including those mentioned in any of the reports or essays, and may make additional purchases and/or sales of those securities without notice.