In an earlier post I pulled the old HUI 888 skeleton out of my closet. 888 (AKA the 3 Snowmen) was a target measurement based on how the chart looked in 2010. It can be liberating to take your worst call and publicize it for the world to see. They tell me that you sell a lot of newsletters that way too . All market geniuses should try it once in a while.
Kidding aside, it can be a lesson in learning from mistakes. Can this chart tell us anything of value today? 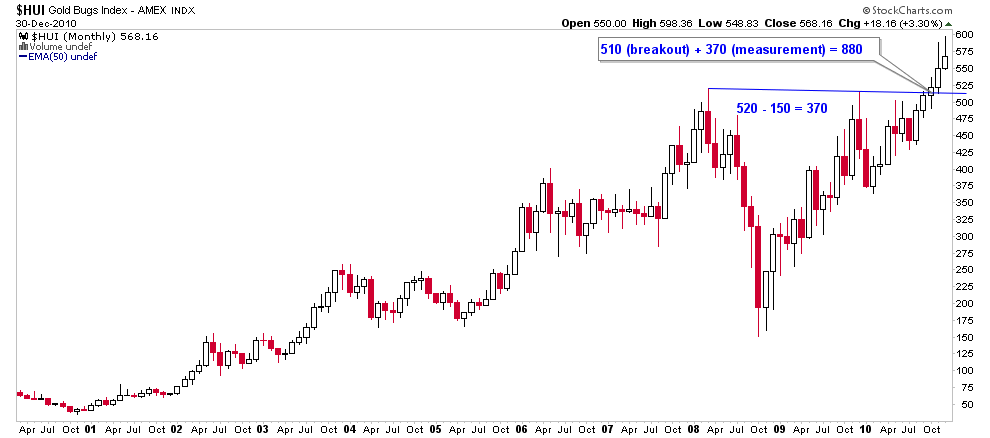
Well what have we here? Oh yes, it is the Russell 2000, an index I used last summer to help stay on the bull path.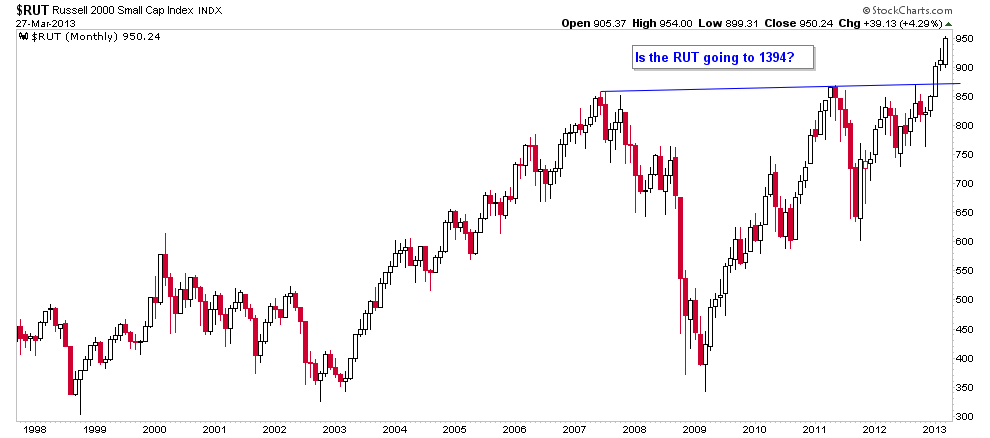
So if HUI was going to 888 I guess that the RUT is going to 1394…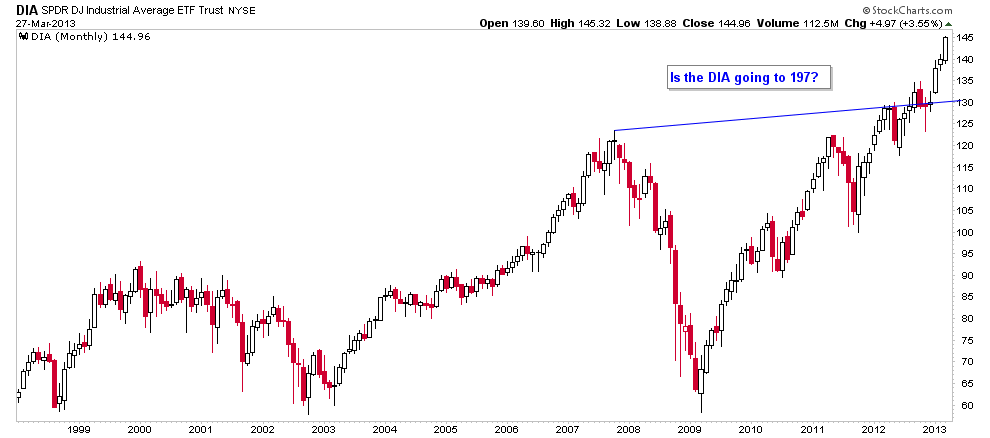
…and the DIA is going to 197…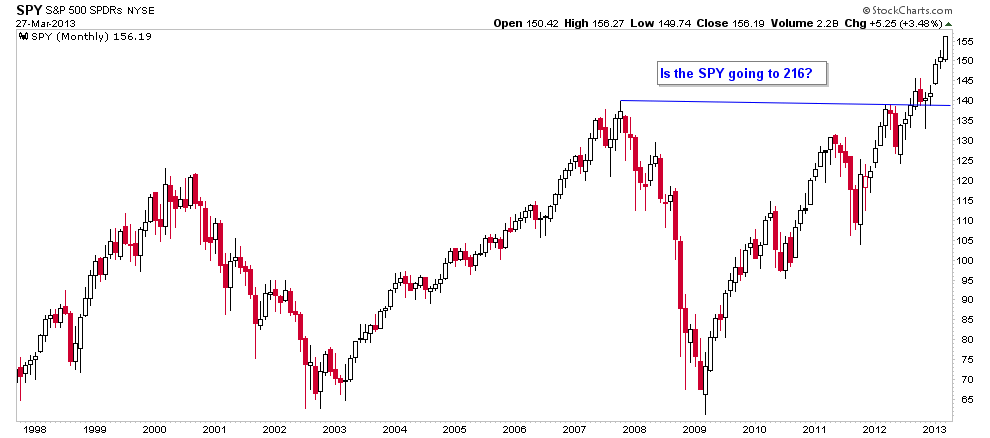
…and SPY to 216?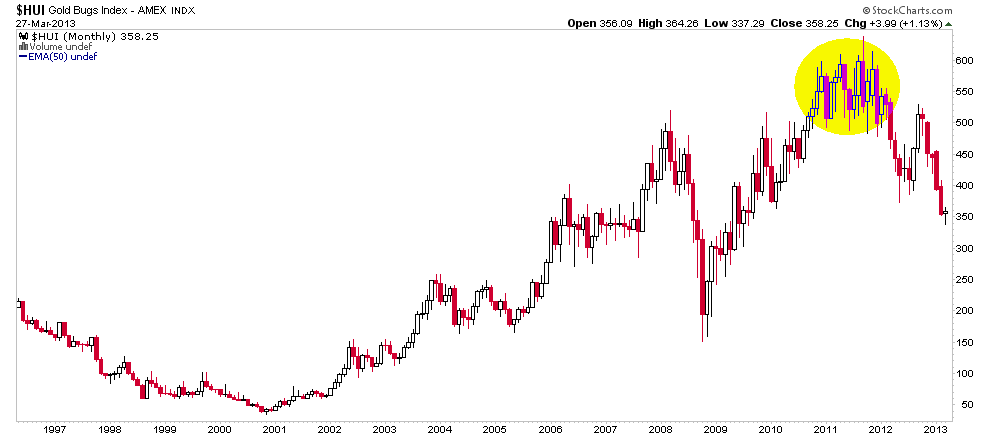
Well that sounds all well and good, but if Huey has any sage-like advice to give today’s US stock market bulls, it might be something like ‘targets are just measurements, not directives’. Huey might also say ‘get ready for a year-long grind that mashes up bulls and bears prior to some very bearish events to come’.
Another thought with respect to the gold stocks… I am glad that they are disconnecting from the broad US market. If HUI were to find support here, they could be on their way higher if the regular markets simply grind it out for many months. Alternatively, if the HUI crashes to the worst implications of the big topping pattern from 2009 to 2012 (it measures to 100), then you might extrapolate forward and wave bye bye USA a couple of years down the road.
Hey, why so gloomy? It’s just a gold stock index. Well yes, but the road map looks uncannily good. Best that the gold stocks find support either here or at the next target of 250 and begin to point the way forward.
[edit] Postscript:
The gold stocks ended a secular bear and led the way out of the first broad US cyclical bear market early last decade. They were among the downside leaders into the 2008 crash and they absolutely launched ahead of everything else that would eventually recover into what we called ‘Hope 09′ back then. So the above corollary is more than a random jumble of charts with similarities. ‘Hope 09′ is now 4 years on and anyone buying the US stock market as a committed investor now is likely to find disappointment or worse going forward.
- English (UK)
- English (India)
- English (Canada)
- English (Australia)
- English (South Africa)
- English (Philippines)
- English (Nigeria)
- Deutsch
- Español (España)
- Español (México)
- Français
- Italiano
- Nederlands
- Português (Portugal)
- Polski
- Português (Brasil)
- Русский
- Türkçe
- العربية
- Ελληνικά
- Svenska
- Suomi
- עברית
- 日本語
- 한국어
- 简体中文
- 繁體中文
- Bahasa Indonesia
- Bahasa Melayu
- ไทย
- Tiếng Việt
- हिंदी
HUI As A Gold Stock Road Map
Published 03/28/2013, 08:37 AM
Updated 07/09/2023, 06:31 AM
HUI As A Gold Stock Road Map
3rd party Ad. Not an offer or recommendation by Investing.com. See disclosure here or
remove ads
.
Latest comments
Install Our App
Risk Disclosure: Trading in financial instruments and/or cryptocurrencies involves high risks including the risk of losing some, or all, of your investment amount, and may not be suitable for all investors. Prices of cryptocurrencies are extremely volatile and may be affected by external factors such as financial, regulatory or political events. Trading on margin increases the financial risks.
Before deciding to trade in financial instrument or cryptocurrencies you should be fully informed of the risks and costs associated with trading the financial markets, carefully consider your investment objectives, level of experience, and risk appetite, and seek professional advice where needed.
Fusion Media would like to remind you that the data contained in this website is not necessarily real-time nor accurate. The data and prices on the website are not necessarily provided by any market or exchange, but may be provided by market makers, and so prices may not be accurate and may differ from the actual price at any given market, meaning prices are indicative and not appropriate for trading purposes. Fusion Media and any provider of the data contained in this website will not accept liability for any loss or damage as a result of your trading, or your reliance on the information contained within this website.
It is prohibited to use, store, reproduce, display, modify, transmit or distribute the data contained in this website without the explicit prior written permission of Fusion Media and/or the data provider. All intellectual property rights are reserved by the providers and/or the exchange providing the data contained in this website.
Fusion Media may be compensated by the advertisers that appear on the website, based on your interaction with the advertisements or advertisers.
© 2007-2024 - Fusion Media Limited. All Rights Reserved.
