One of the main types of short-term trade setups that is part of our proven swing trading strategy is to buy Potential Breakouts above valid bases of consolidation, in stocks exhibiting relative strength in the broad market. Recently, we did so with a swing trade in Onyx Pharmaceuticals (ONXX), which enabled us to score a 10% gain on the price of the stock over just a 3-day holding period. In this educational trading strategy post, we visually walk you through the technical trade setup that led to the winning result.
ONXX initially came onto our radar screen as a potential swing trade buy entry because it met the basic technical filtering criteria used by our “turn key” stock screener for Potential Breakout setups. These pre-programmed rules for automated filtering include:
- Stock must be exhibiting a top RS (relative strength) rating, meaning it has been outperforming a vast majority of stocks in the market over the past six months.
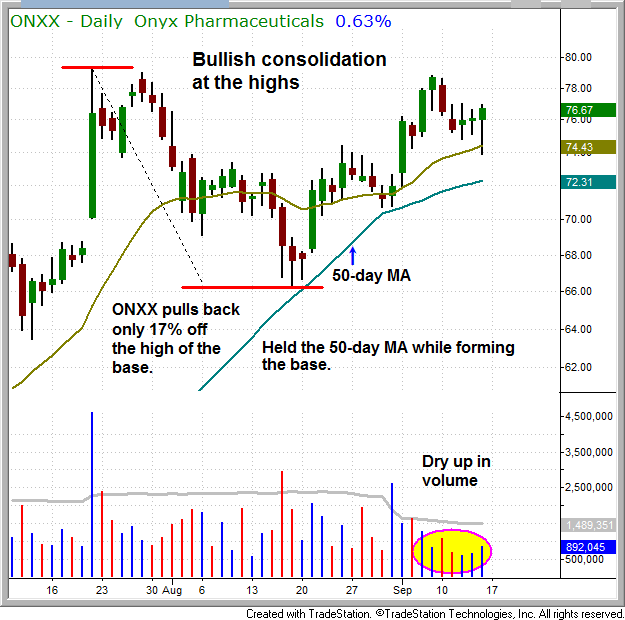
- Stock must be forming a tight base of consolidation near its 52-week high, with the retracement from the high of the base being not more than 20% below the peak.
- All three major moving averages we follow (20, 50, and 200-day MA) must be trending in the right direction
- ONXX is a biotechnology stock, which has been one of the strongest industry sector groups of the year. Odds of successful trade are significantly increased when the individual stock is part of a strong sector that has been exhibiting relative strength to the broad market.
Because all the predefined rules for a Potential Breakout setup were met, ONXX was showing up on our technical stock screener as a possible buy candidate. At that point, we merely needed to wait for the price action within the base to tighten up, and form a buyable “handle,” which subsequently occurred between September 7-14. The technical setup of the trade is annotated on the chart below:
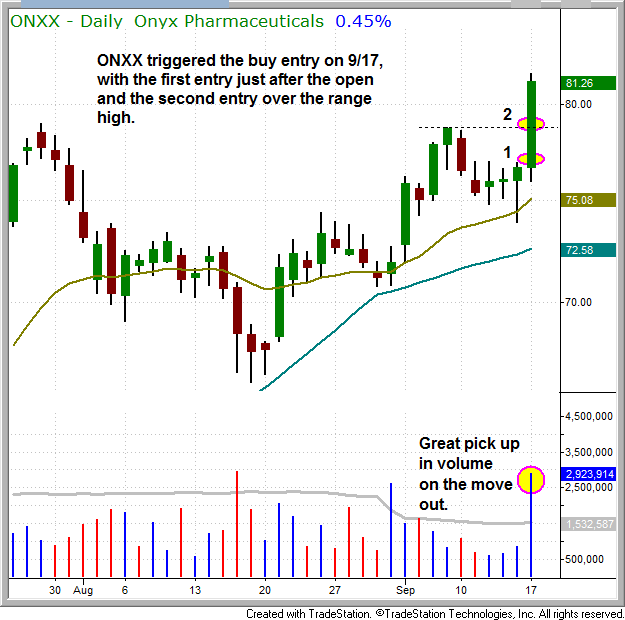
As shown on the chart below, ONXX triggered our swing trade buy entry one day later, on September 17. Our initial buy entry into the trade was just after the market opened (above the previous day’s high), and then we added additional shares to the swing trade when ONXX broke out above the high of its “handle” (the horizontal dotted line). Notice that volume also surged well above its 50-day average level, confirming the breakout to a new high:
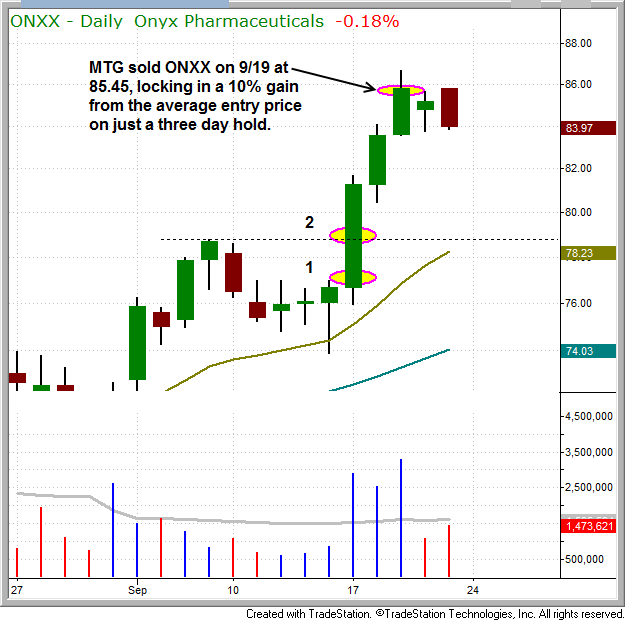
In this third and final chart, you can see how swiftly ONXX zoomed to another fresh 52-week high. Because the move happened so quickly, we made a judgment call to sell into strength on September 19, locking in a solid 10% average gain at the $85.45 level, just before the stock entered into another base of consolidation:
When buying breakouts, we typically manage the exit in one of two ways. If the move is sharp and happens very quickly, we sometimes sell into strength and lock in a quick gain of 10 to 12% with a holding time of just a few days. This is how we managed the ONXX trade. However, when a stock is acting very well and climbing steadily higher, we often choose to sit through the first pullback or short-term price consolidation instead, which enables us to capture a 20 to 30% gain with a longer holding period that averages around 2 to 3 weeks.
