
As a short-term trader, one of the best ways to make consistent profits and take them out of the market is buying oversold gap fill set ups. I’m looking for strong stocks that are having very rapid short term pullbacks in price. When I see the pullback, I immediately check the 5- or 10-day charts on an hourly basis and look for any gaps in the chart below.
Defined
Gaps are a situation where a stock moved up with a higher bid price than a recent closing price (Can be on a 15 minute, hourly, or daily basis even) and never came back down to where that Gap was created. These gaps often close because traders set stops just at or below where that gap was created and then often the computer trading systems end up running all the stops until the final stops are filled at or below those gaps.
I use that type of arbitrage and volatility to scale into that stock as the gap is approaching. I never try to buy the exact gap because often a stock will fill the gap on 100 shares and then reverse quickly to the upside, and then you are stuck watching and or chasing the stock higher. This only adds further risk to your trading, not less.
Often a gap will fill and the stock will dip a bit below the gap as well, so I will continue to buy shares as that occurs as well looking for the reversal while lowering my average entry point at the same time.
DATA Sample
We have a real-time sample below in DATA (Tableau Software), a recent IPO. This stock is pretty thinly traded so it can move up or down a few dollars quickly for no real reason, thus creating the arbitrage. Yesterday this peaked near $60 and as of this morning it was trading below $55 per share on light volume as a gap on the 10 day chart was sitting there around $54.80. Noting that gap and the near term oversold condition, as a trader, you would want to begin to buy just over 55 and down to and below the gap. The stock filled that gap and dropped into the 54.50′s briefly.
The stock then recovered to $56.30 just 15-20 minutes later, giving that trader a quick $1.20 -$1.50 per share profit on his or her position in very little time.
Now this pattern repeats over and over again every week in the market giving the savvy trader opportunities all week long. At our ATP service we somewhat use the same idea, though not on a 1-2 hour scale per se, but the same general concept applies. Time frames can be much different, but the idea is it is one reversal technique you can deploy with attack capital to take money out of the market.
You must be quick on your feet and not afraid to pull the buy trigger, add to your position, and then move to sell at the appropriate time. This technique is best for the more advanced trader who has time to watch the screen.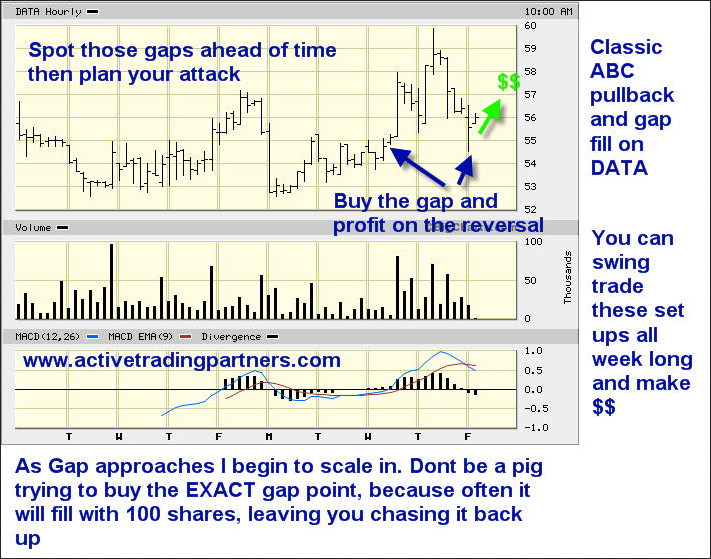
- English (UK)
- English (India)
- English (Canada)
- English (Australia)
- English (South Africa)
- English (Philippines)
- English (Nigeria)
- Deutsch
- Español (España)
- Español (México)
- Français
- Italiano
- Nederlands
- Português (Portugal)
- Polski
- Português (Brasil)
- Русский
- Türkçe
- العربية
- Ελληνικά
- Svenska
- Suomi
- עברית
- 日本語
- 한국어
- 简体中文
- 繁體中文
- Bahasa Indonesia
- Bahasa Melayu
- ไทย
- Tiếng Việt
- हिंदी
How To Profit On Gap Fill Swing Trades
Published 06/28/2013, 11:17 AM
Updated 07/09/2023, 06:31 AM
How To Profit On Gap Fill Swing Trades
3rd party Ad. Not an offer or recommendation by Investing.com. See disclosure here or
remove ads
.
Latest comments
Install Our App
Risk Disclosure: Trading in financial instruments and/or cryptocurrencies involves high risks including the risk of losing some, or all, of your investment amount, and may not be suitable for all investors. Prices of cryptocurrencies are extremely volatile and may be affected by external factors such as financial, regulatory or political events. Trading on margin increases the financial risks.
Before deciding to trade in financial instrument or cryptocurrencies you should be fully informed of the risks and costs associated with trading the financial markets, carefully consider your investment objectives, level of experience, and risk appetite, and seek professional advice where needed.
Fusion Media would like to remind you that the data contained in this website is not necessarily real-time nor accurate. The data and prices on the website are not necessarily provided by any market or exchange, but may be provided by market makers, and so prices may not be accurate and may differ from the actual price at any given market, meaning prices are indicative and not appropriate for trading purposes. Fusion Media and any provider of the data contained in this website will not accept liability for any loss or damage as a result of your trading, or your reliance on the information contained within this website.
It is prohibited to use, store, reproduce, display, modify, transmit or distribute the data contained in this website without the explicit prior written permission of Fusion Media and/or the data provider. All intellectual property rights are reserved by the providers and/or the exchange providing the data contained in this website.
Fusion Media may be compensated by the advertisers that appear on the website, based on your interaction with the advertisements or advertisers.
© 2007-2024 - Fusion Media Limited. All Rights Reserved.