- A combination of technical and fundamental analysis can play a key role in making investment decisions
- In this piece, we will use Apple as an example as we combine InvestingPro's fundamental analysis tools with regular technical analysis
- Also, we will explore Apple's financial health by assessing its scores in areas like profit margins, liquidity, and debt
- Looking for more actionable trade ideas to navigate the current market volatility? Members of Investing Pro get exclusive ideas and guidance to navigate any climate. Learn More »
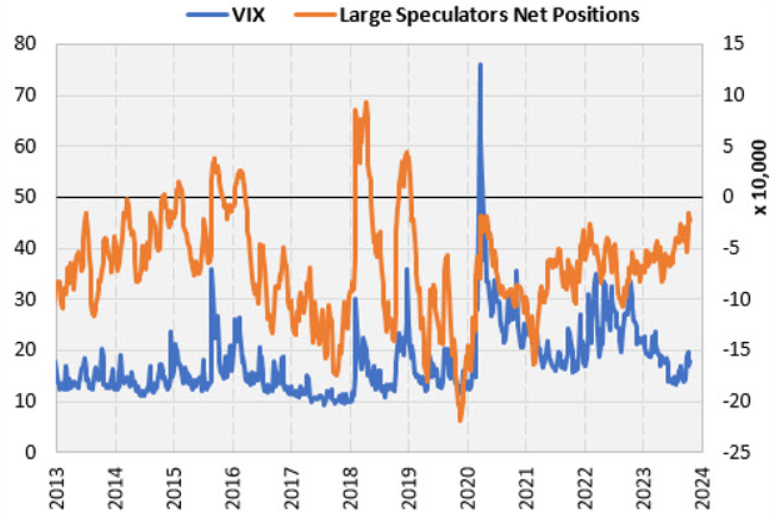
Historically, shifts in the CBOE Volatility Index positioning have consistently coincided with stress level peaks, triggering counter-directional movements in the stock market.

However, a noticeable shift is occurring now, as the latest data reveals a move towards long positions for the first time since the outset of 2019.
In fact, long positions are now surpassing their levels at the beginning of the year. If this trend continues, long positions may eventually outweigh the short ones in the coming months.
On the other hand, a plethora of macroeconomic headwinds, such as higher rates, lingering inflation, and dwindling earnings growth, keep on sending risk-off messages to investors.
So, is it time to go bullish or bearish on the S&P 500?
Well, we don't know for sure. However, what we do know is that having the answer to this question shouldn't be as crucial as being allocated to the right companies in the long run.
While timing the market is a fool's errand, time in the market can be a powerful ally — even more so when you find the right companies to go long on.
This is why conducting comprehensive fundamental and technical analyses plays a pivotal role in shaping investment decisions and mitigating undesirable outcomes.
When it comes to fundamental analysis, InvestingPro is the top tool available for retail investors. It provides retail investors with access to the same data that the world's largest investment banks and money managers rely on.
To leverage this data even further, investors can combine the power of InvestingPro with technical analysis, gaining a significant edge over the competition. Over the next section, I will use the example of Apple's (NASDAQ:AAPL) stock to show you how to do that.
Combining Technical With Fundamental Analysis to Analyze Apple's Prospects
We will begin by analyzing Apple using InvestingPro's fundamental tools and regular technical analysis to gain some insights on the stock's prospects.

Source: InvestingPro
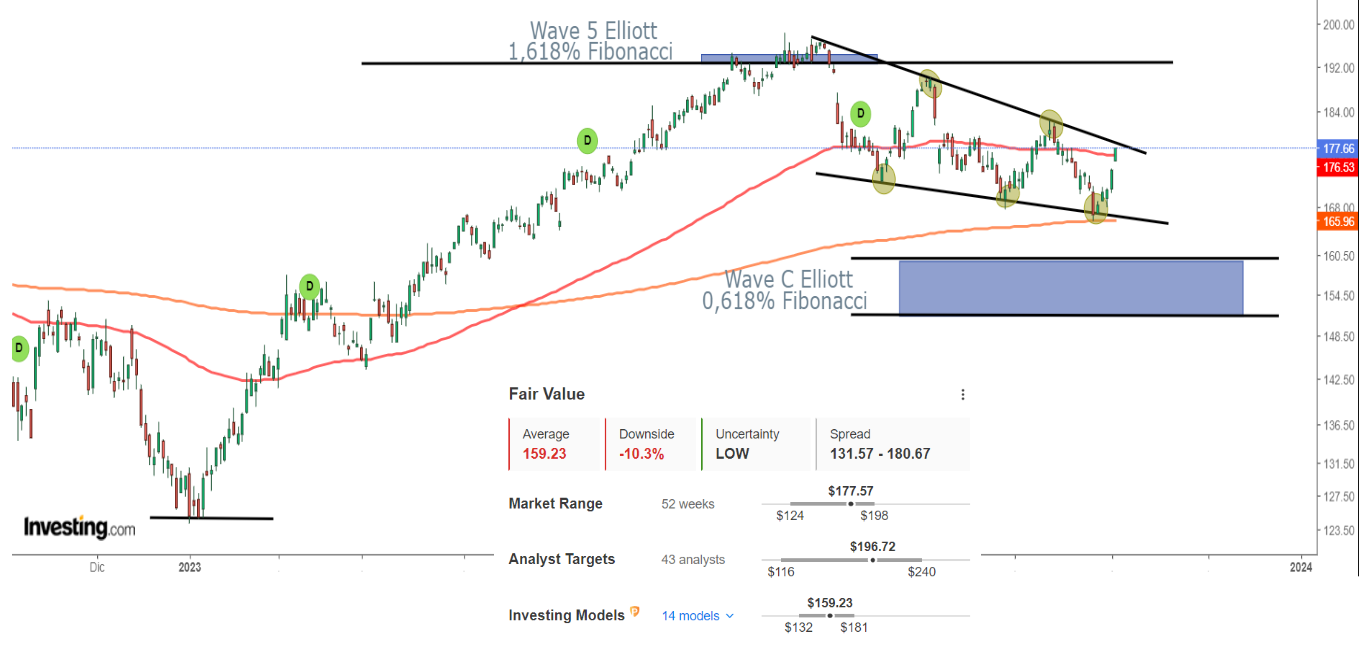
Applying the relationship between Fibonacci and Elliott wave analysis, we've identified the first wave 5, which corresponds to the peak of the impulse waves 1-2-3-4-5, followed by wave C, representing the completion of the a-b-c retracement. This analysis points to a potential target price range between $160 to $150.
To confirm our analysis, we turn to InvestingPro, where we consider the Fair Value and the target price determined through 14 different models, which aligns with a target price of $159. Furthermore, it indicates a possible downside of -8% with a low degree of uncertainty.
Additionally, the spread price analysis shows a periodic swing range between $131.5 to $180, calculated as an average between the price trend over the last 52 weeks, analysts' target price (43), and the insights provided by the InvestingPro tool.
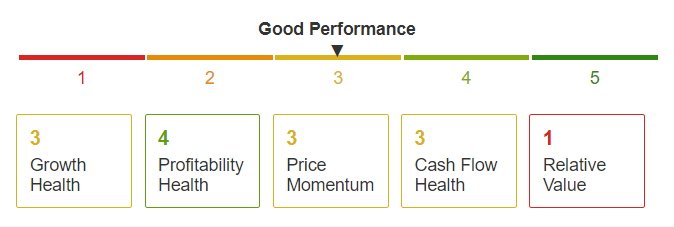
In addition to technical analysis, it's crucial to evaluate Apple's financial health. This assessment involves ranking the company based on over 100 key factors when compared to others in the same industry, providing valuable insights into its overall stability and performance.

Source: InvestingPro
The company earned a score of 3 out of 5 by scoring average against all of its competitors on profit margins, high earnings quality, higher liquidity than debt on the balance sheet, and free cash flow exceeding net income. Delving deeper, however, we can see how the comparison with the market and competitors, sees the stock at not only absolute but also high relative valuations

Source: InvestingPro
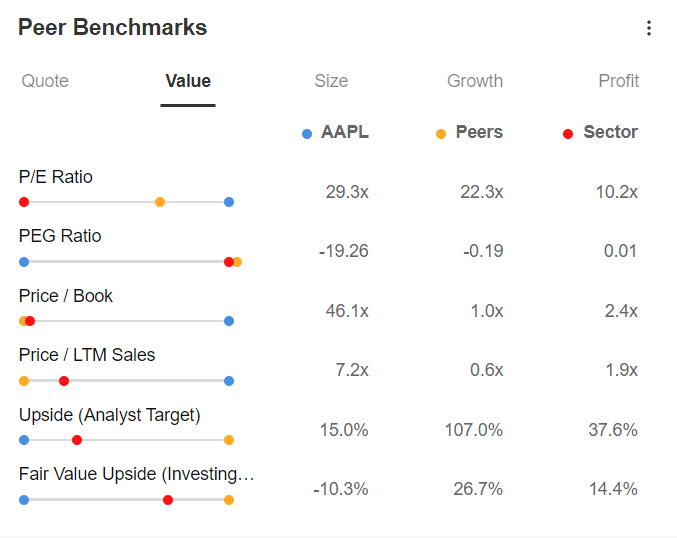
When we assess Apple's valuation against some of the most widely recognized indicators, the numbers raise concerns. Apple's current market capitalization is more than 7 times its annual revenues, and it's trading at a multiple of approximately 29 times its profits.
Adding to these concerns, the company's guidance for the next quarter predicts revenues on par with the previous year, indicating a 5% decline from previous estimates. This marks the fourth consecutive quarter of lower-than-expected revenue performance.
Compounding these issues, Apple's liquidity, both in terms of gross ($162 billion) and net ($51 billion) liquidity, is on a downward trend, approaching levels last seen in the 2010-2014 period. This trend is mirrored by a reduction in dividends, further suggesting a shift in the company's financial health.
This goes to confirm my bearish view of the stock.
***
Disclaimer: This article is written for informational purposes only; it does not constitute a solicitation, offer, advice, counsel or recommendation to invest as such it is not intended to incentivize the purchase of assets in any way. I would like to remind you that any type of asset, is evaluated from multiple points of view and is highly risky and therefore, any investment decision and the associated risk remains with the investor.

