
The market remains is a state of contained activity until the FOMC policy statement and press conference by its Chairman Jerome Powell later on Wednesday. Equities in the US, with our attention always on the S&P 500 as the bellwether, failed to keep the bullish tendencies going amid the resisting tactics by China as part of the trade negotiations. It has been reported by Bloomberg that the Big Panda (China) keeps playing hardball and that is based on accounts from some US negotiators, concerns are starting to emerge about the stubbornness of China to apply changes to their data protection and intellectual property policies amid the lack of assurances that existing tariffs will be lifted. There is the camp arguing that China is backtracking its initial commitments for a deal to transpire, while others involved in the negotiations believe this is the normal process of any negotiations. By the end of business in NY, the S&P 500 closed down by just under 0.3%.
The USD also continues broadly softer, stripping out a significant spike in US bond yields, which saw about a 50% retracement as the day went by, not helped by a poor print in US factory orders (0.1% m/m vs 0.3% expected). The US 10 year yield stands at 2.61% while the 30 year exchanges hands at 3.02%. A currency where one could anticipate greater vol, even if it never materialized was the British pound as the inconclusive state of the Brexit conundrum continues. The latest we learned is that UK PM May is mulling the possibility of requesting for an extension of Article 50 to June 30, even if rumor has it that the extension could be way beyond this time horizon and all of us stuck reporting the Brexit mess for another year or two, which is the timeframe the BBC speculates in a report on Tuesday. Even if a sideshow due to Brexit, the UK published surprisingly solid employment numbers. As the Economics Team at ING notes, “the UK labor data looks astonishingly strong for an economy that is supposedly slowing on most other measures. If the government gets a long Brexit extension, a Bank of England rate hike is clearly on the table for the summer.”
The two currencies that enjoyed the greatest buying interest were the Canadian dollar and the euro. While the euro’s rise was slow and consistent throughout the day (aided by a marked improvement in the German ZEW economic survey series), the Canadian dollar saw an abrupt spike that lasted a few hours as the US session came online only to retrace most of its gains by the end of business in NY. A currency that underperformed the rest during Tuesday was the Australia dollar, which reflects its degree of sensitivity towards new developments in the US-China trade negotiations. The Kiwi did better, contained in a tight range against the USD. Lastly, the Japanese yen, amid the drop in the US dollar and the rise in US yields, that alone led to diversification away from risk off instruments, with buy-side flows in equities for the first half of the day further promoting JPY sell-side action.
Dashboard: Intermarket Flows and Technical Analysis
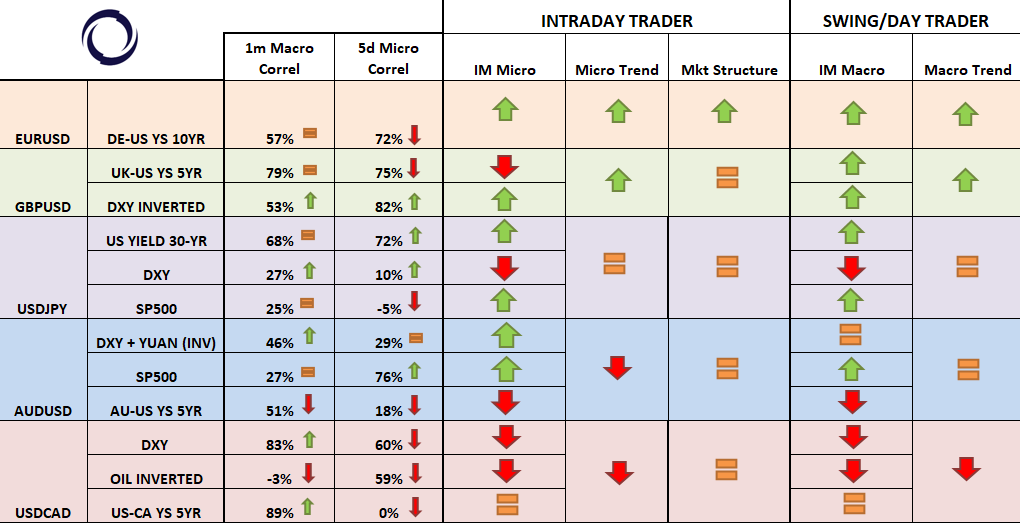
Summary: Intermarket Flows & Technical Analysis
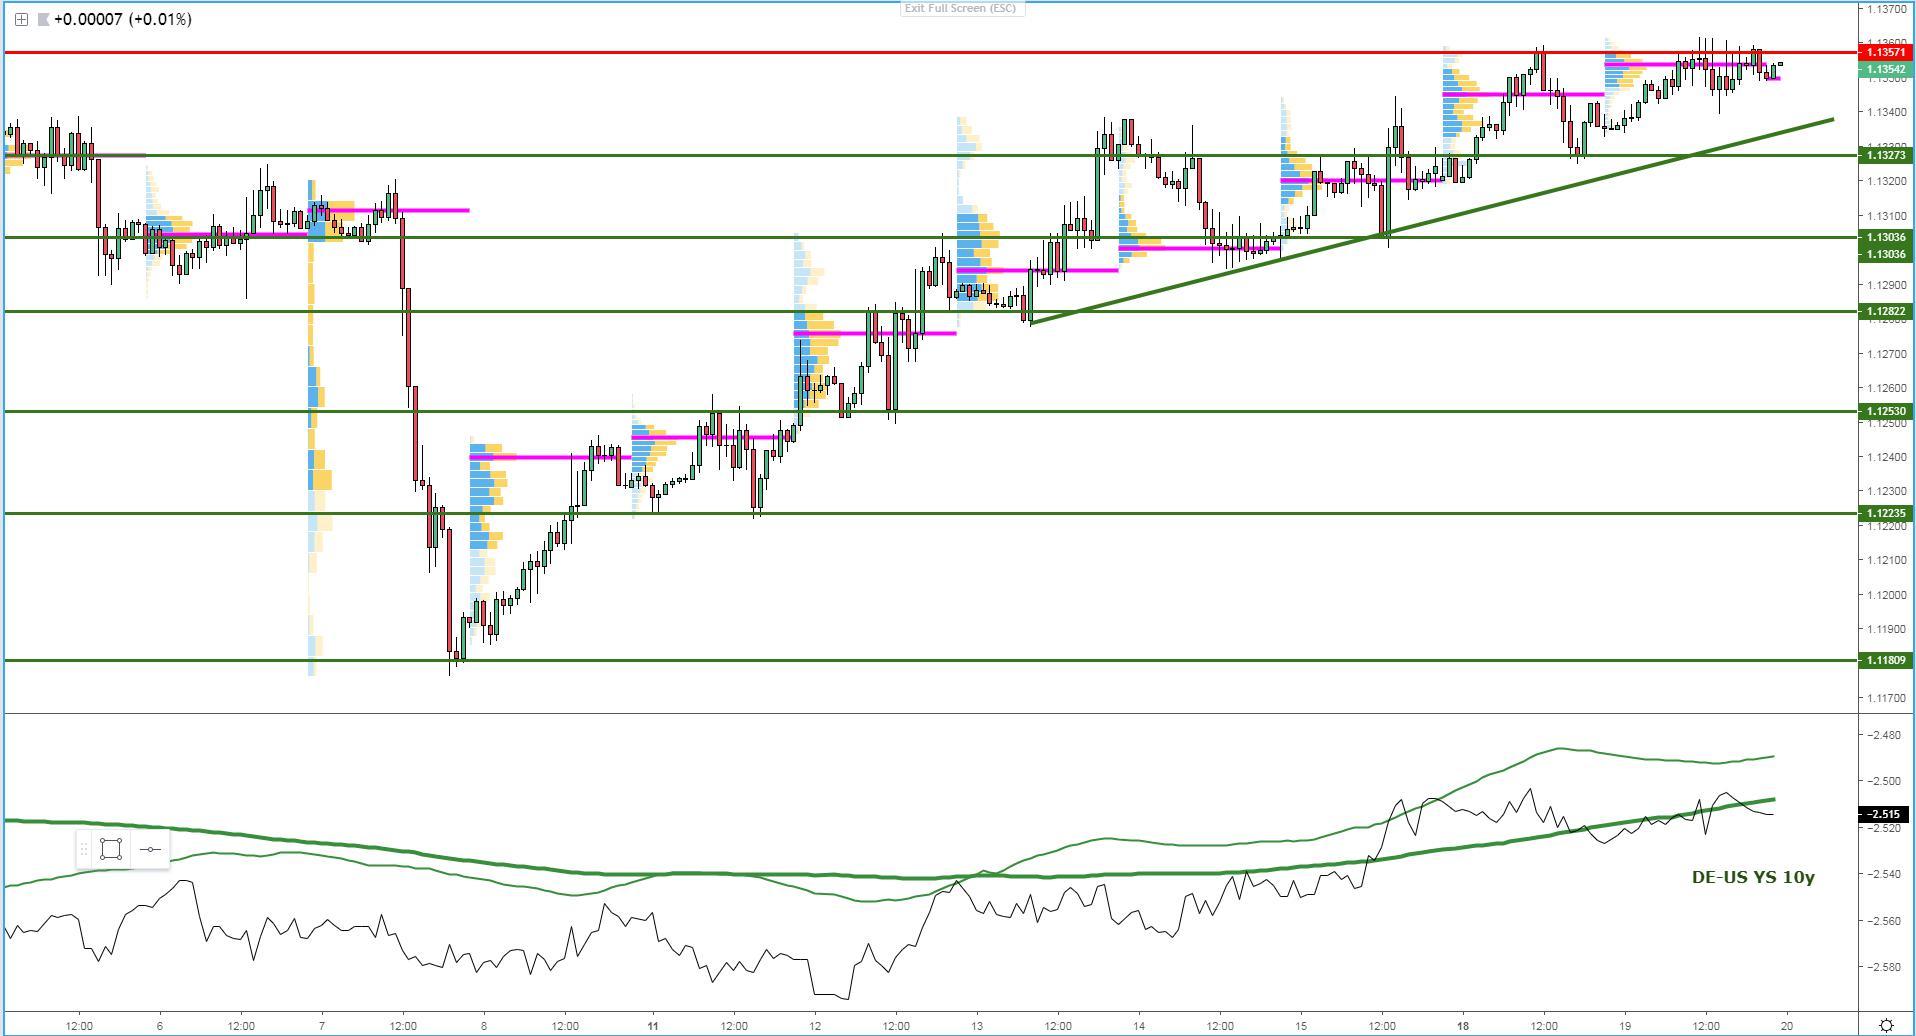
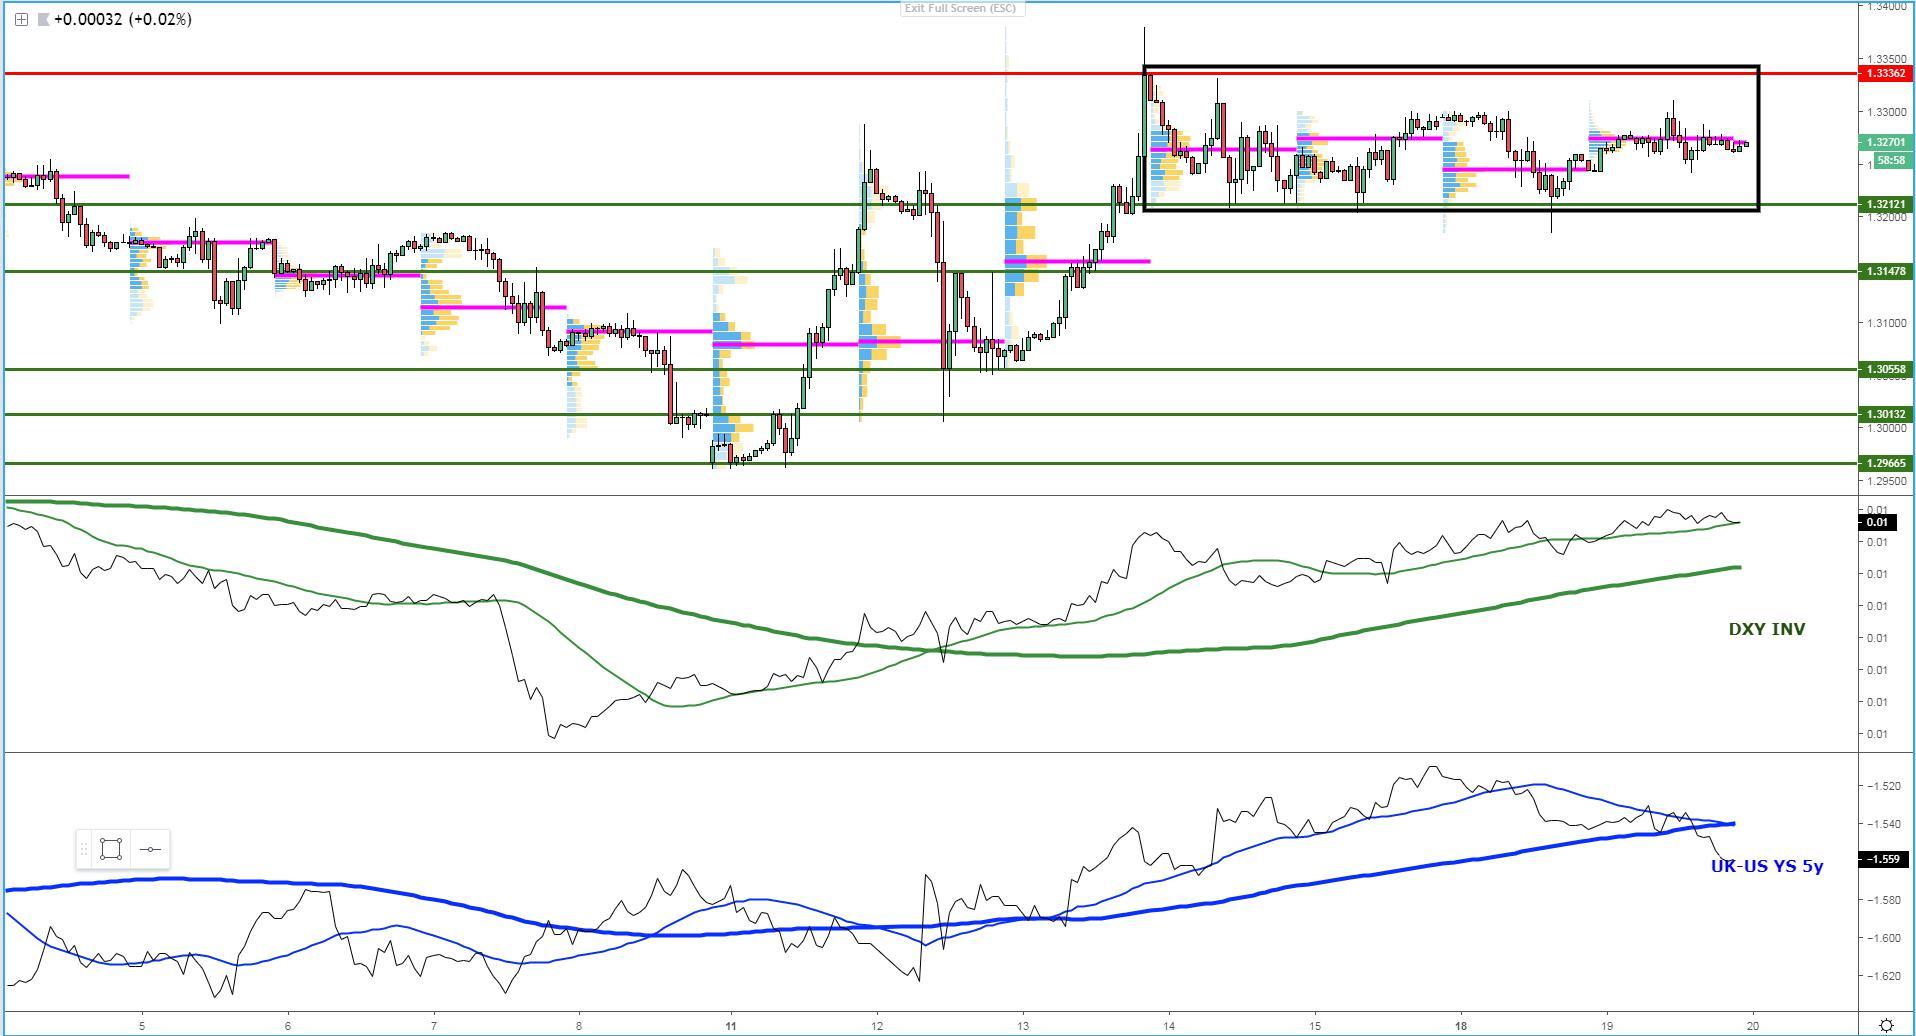
EUR/USD: Steady Buying, Not Sufficient To Break Resistance
- Ahead of the FOMC event later today, the pair has been bid steadily but not enough bids to materialize a break of the previous highs, which increases prospects of a range till the FOMC.
- The P-shaped volume profile formation is a reminder of the amount of offers concentration overhead, which is preventing further progress ahead of the price reassessment post FOMC.
- An ascending trendline originating off March 13th low is still guiding the bullish structure, hence expect any setback to see a fight around the critical level.
- The risk of getting caught in a chopfest ahead of the FOMC by engaging at the wrong levels is substantially high, so make sure you pre-select the key areas (I provide levels of reference).
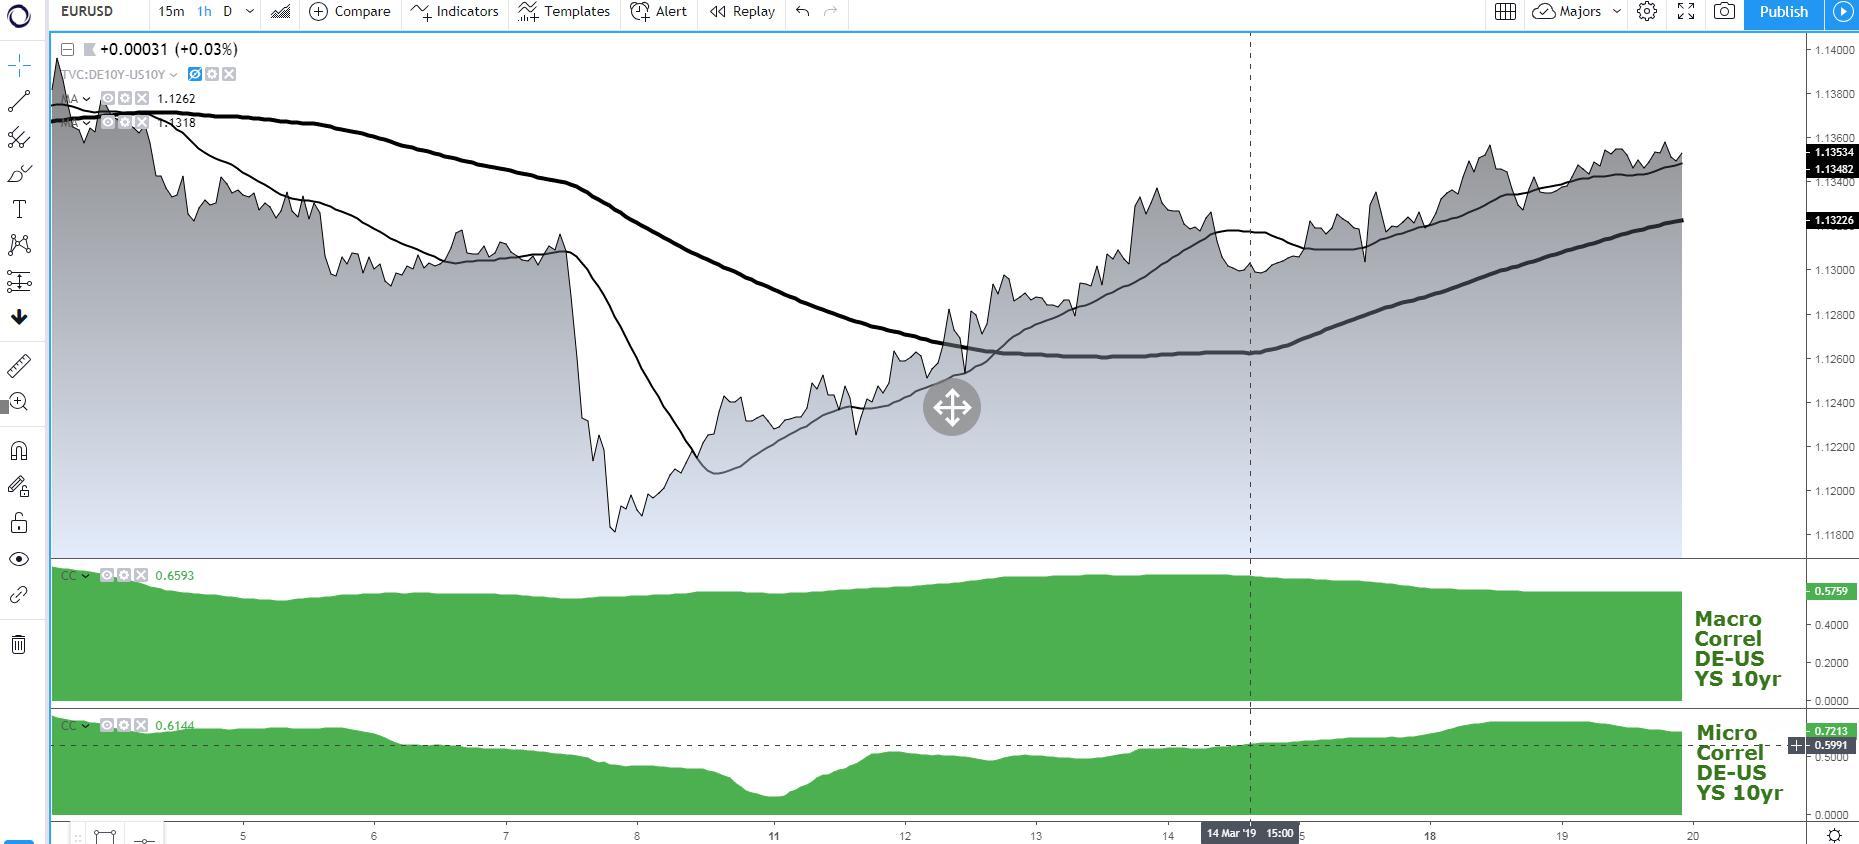
- If we are to take as reference the 10-year spread in bond yields between Germany and the US, which acts as a leading indicator, the bias still remains to the upside.
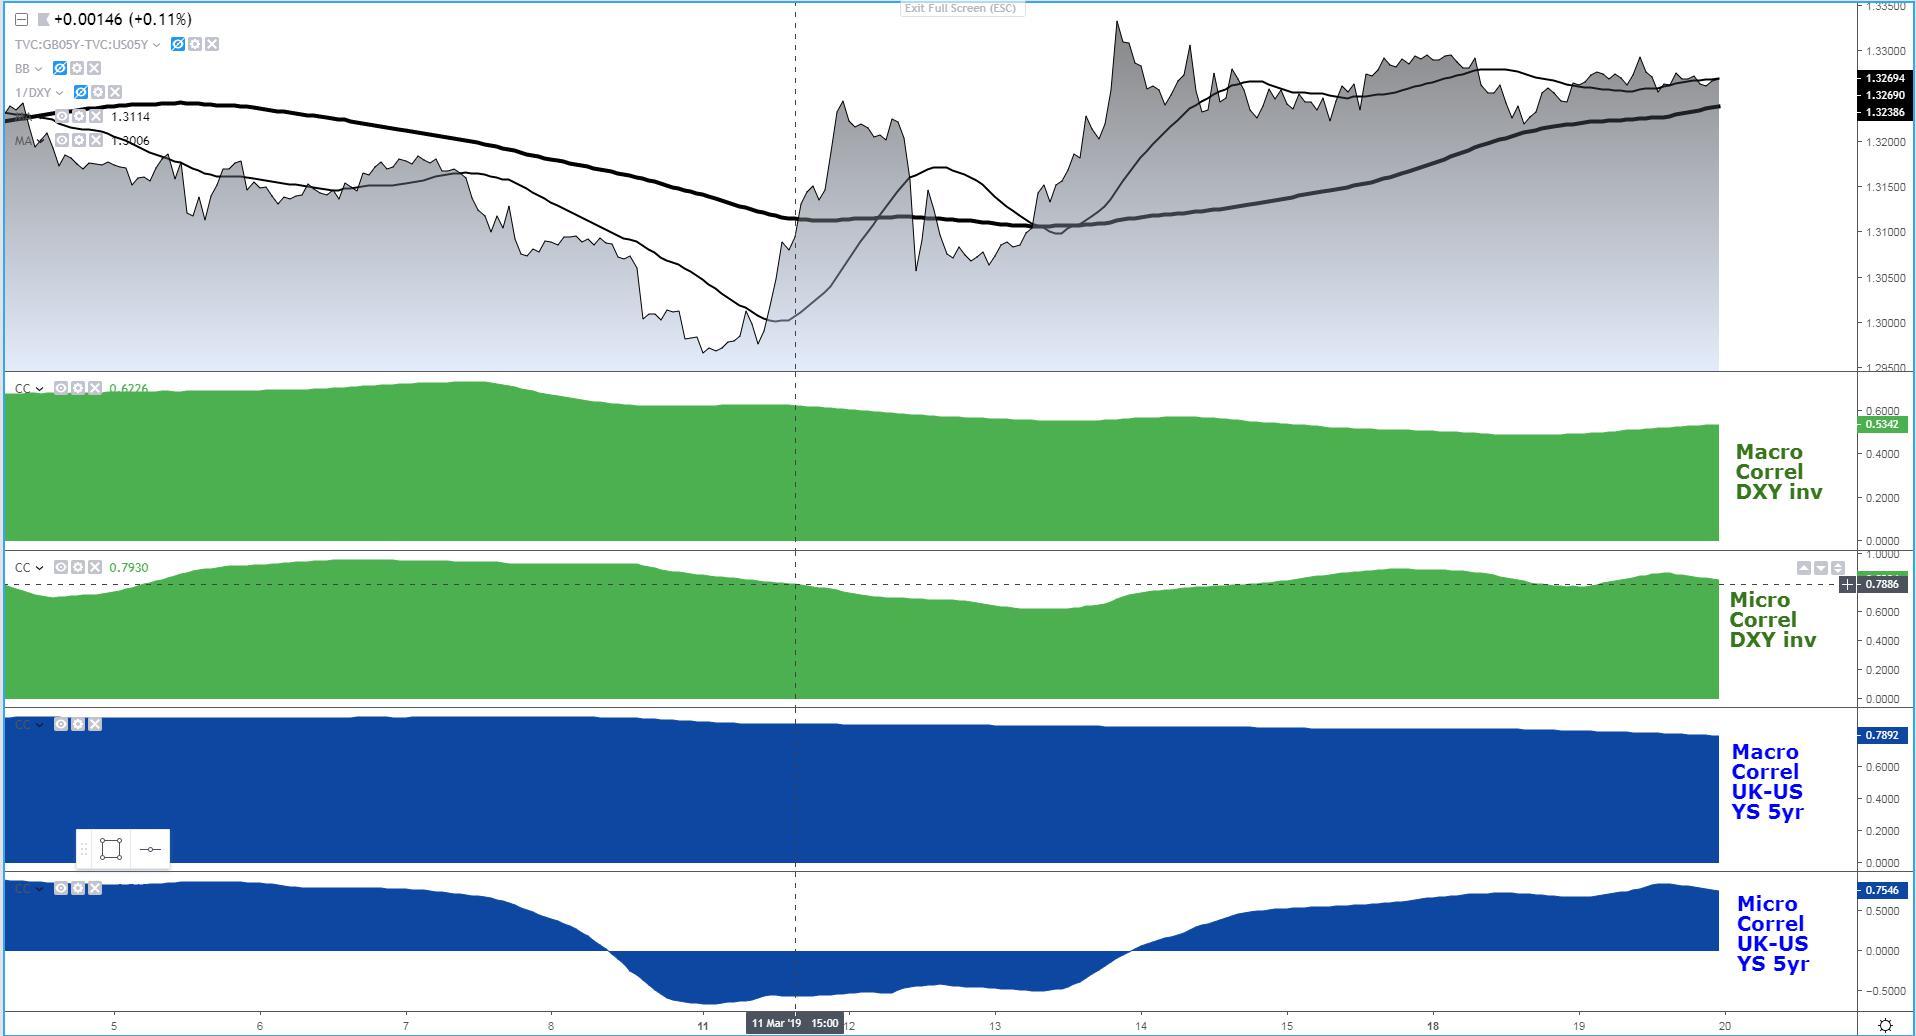
GBP/USD: Directionless Flows Ahead Of Brexit Summit
- The GBP continues in a holding pattern with little interest to take the currency exchange in either direction, currently trapped in the middle of its 1.3350-1.3200 range.
- The weakening trend in the DXY still suggests setbacks can be seen as buying opportunities, even if any setup likely to be suboptimal until the UK-US bond yield spread can recover.
- The overall trend in the last week before the balance area formed has been to the upside, forming a structure of higher highs and higher lows.
- The volume profile single distribution from Tuesday is a clear testament of the limited interest to transact the sterling until we can get further clarification on Brexit.
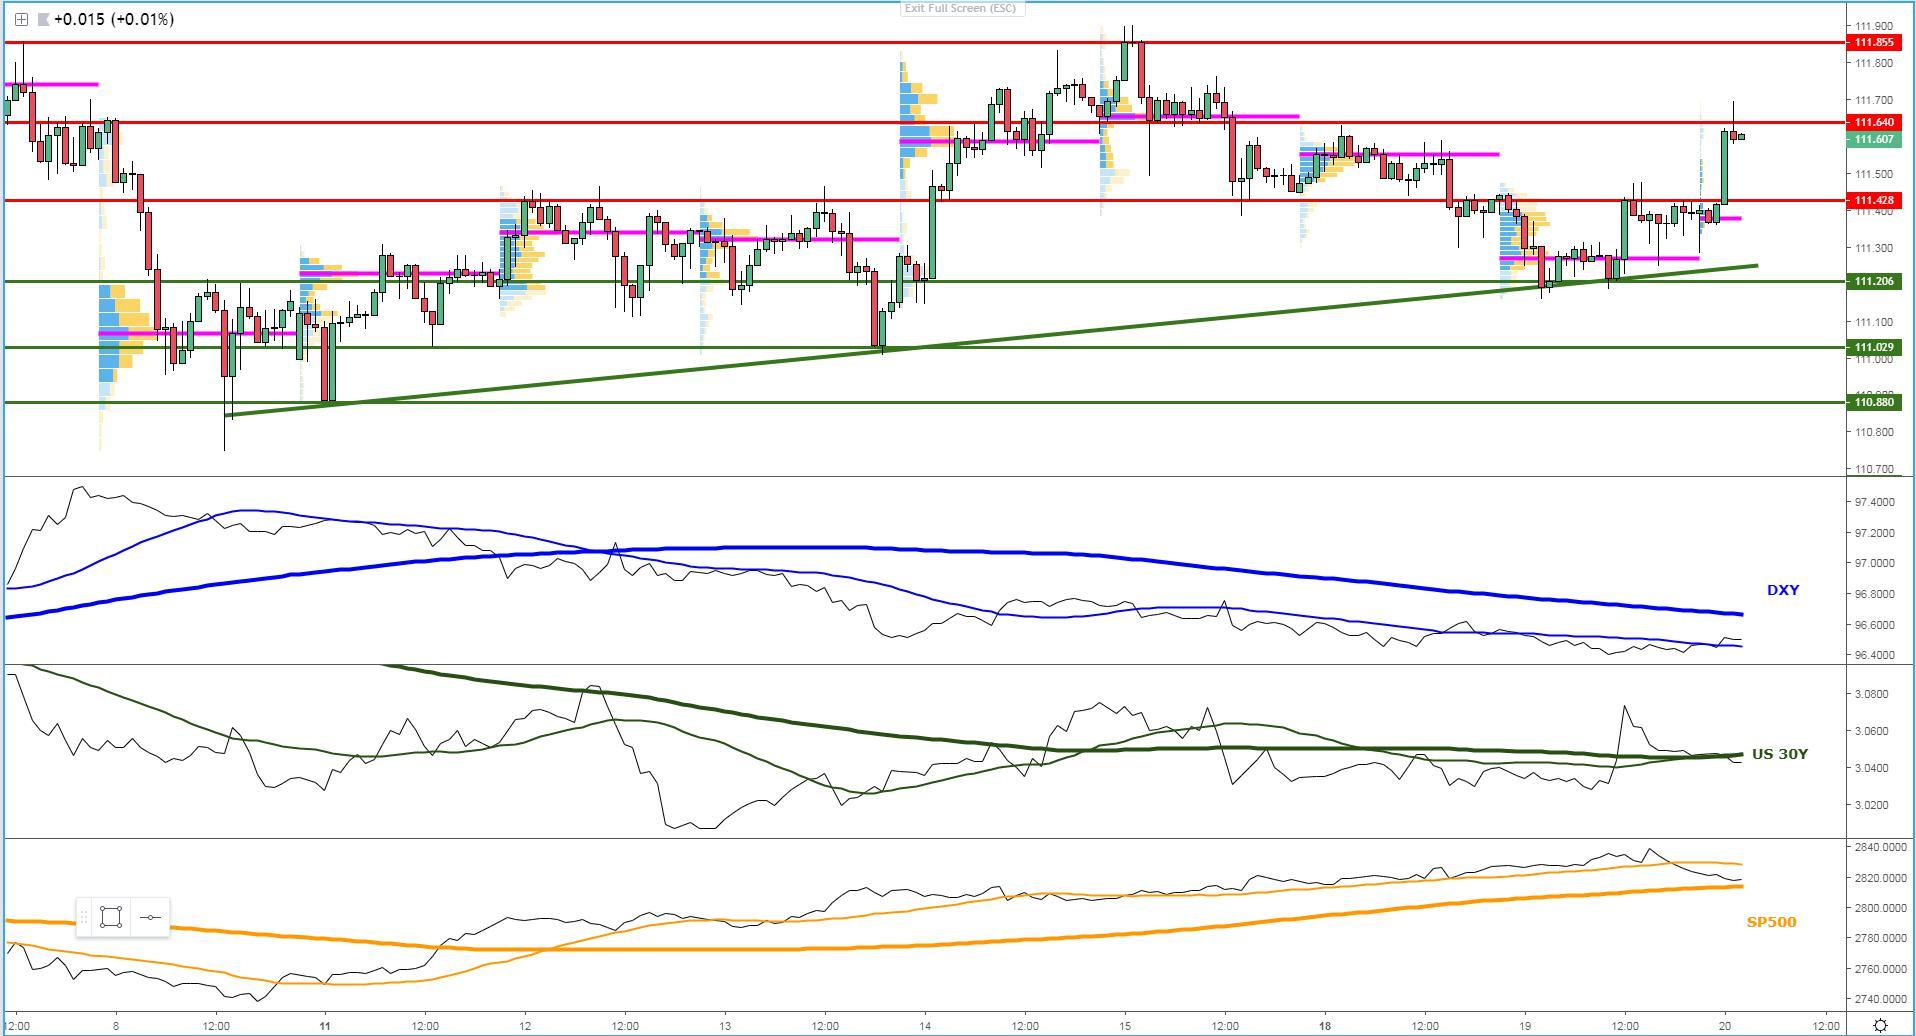
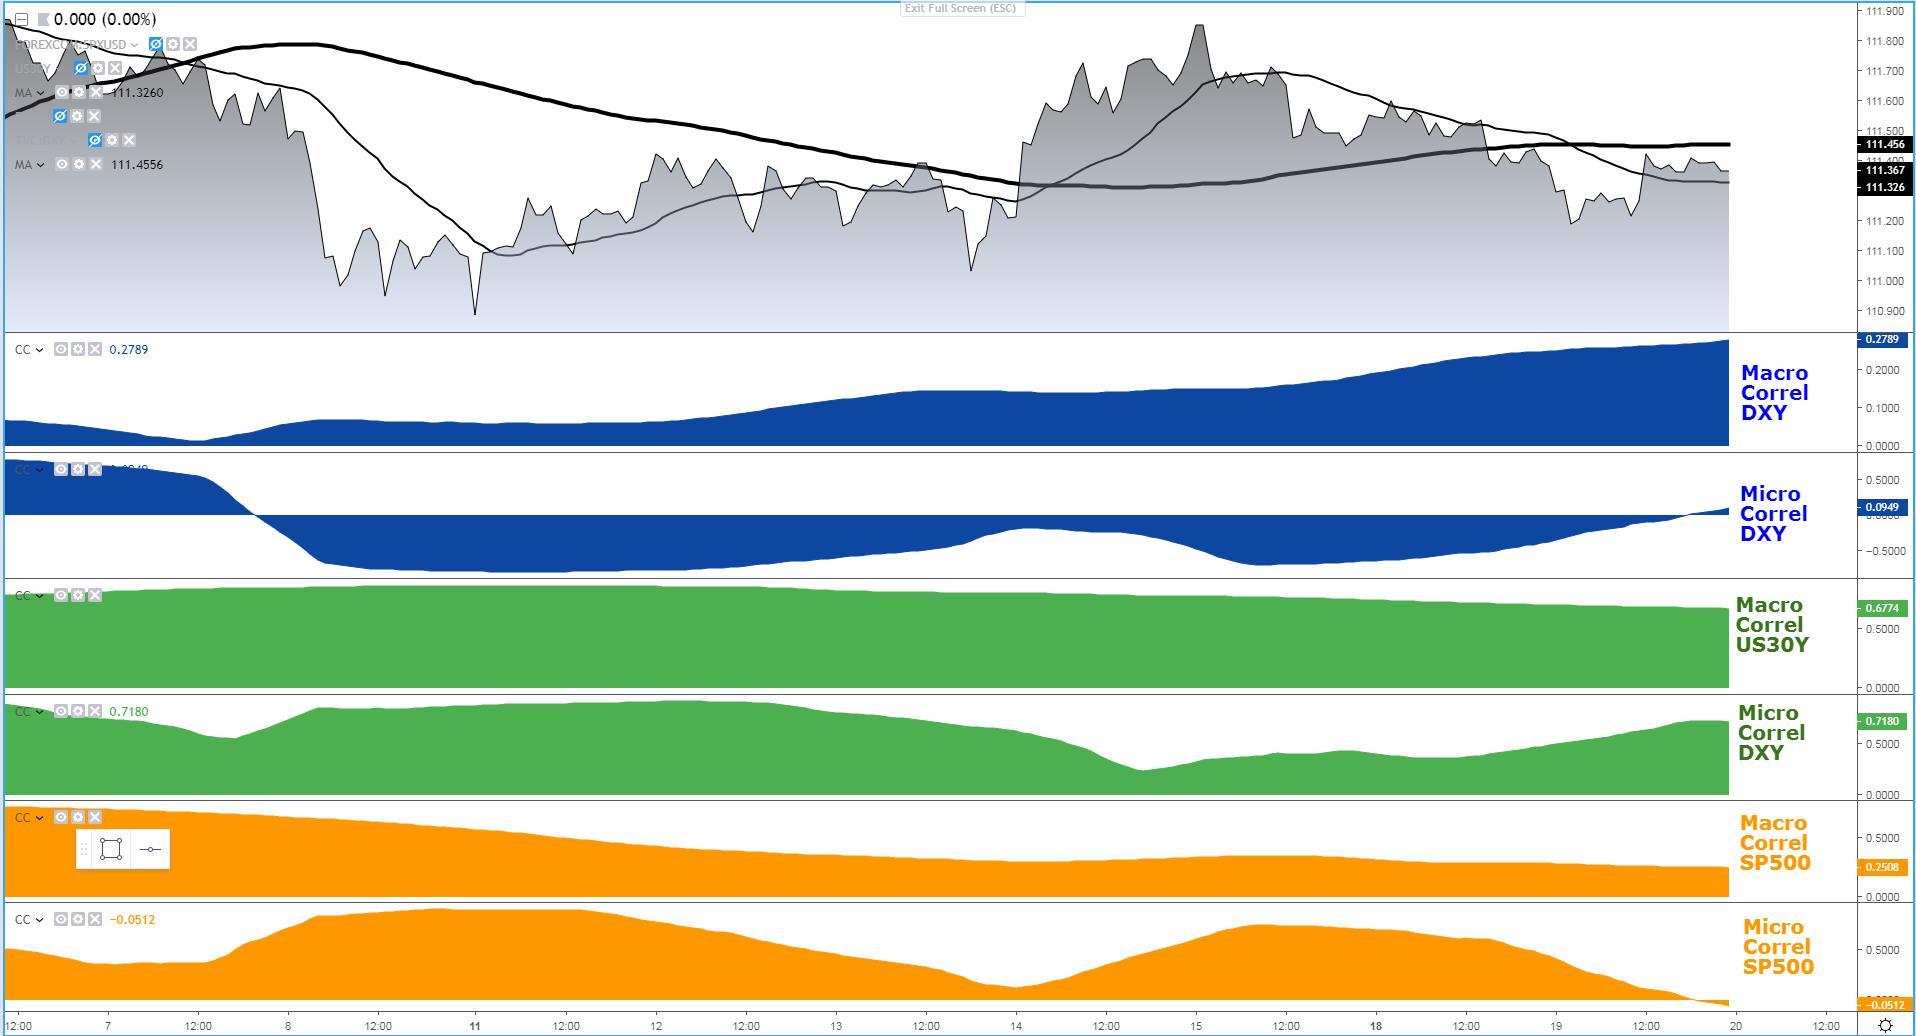
USD/JPY: Reliable Trendline, Move Up Lacks DXY Support
- Spike in Asia a bit overdone. DXY in a bearish trend daily and weekly standpoint. US 30y backing up the move but not in tandem with lower equities.
- The move higher in Asia lacks sufficient credence, which is why I tend to like to see DXY, US yields front-running UJ for value propositions and not the other way around.
- The pair remains technically alive as it finds a major cluster of bids at the intersection of the ascending trendline during Tuesday’s trading activity.
- It’s going to take a significant recovery in the DXY to justify much higher prices, or alternatively, equities to regain their mojo to permute back into a state of ‘true risk on’.
- The injection of vol post FOMC will be the highlight of the day. Be always reminded to close your positions if short-term in nature and re-evaluate once liquidity back to normal levels.
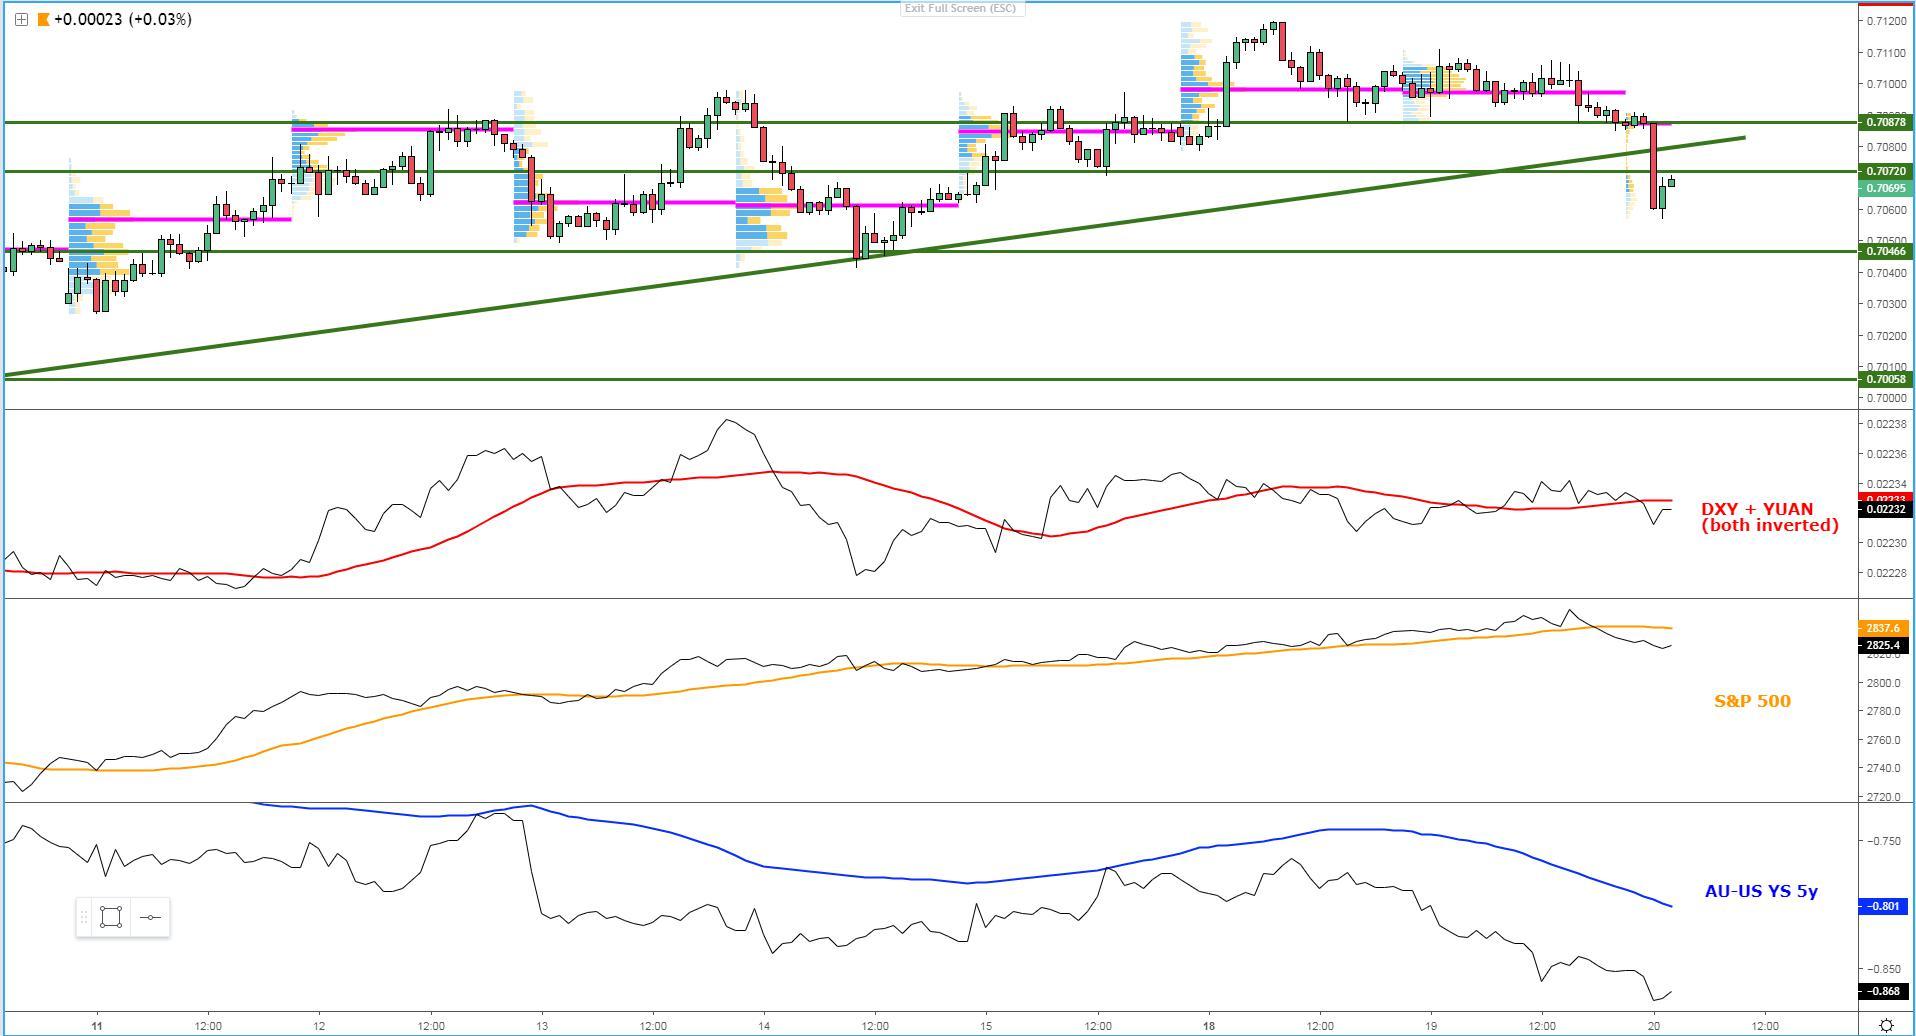
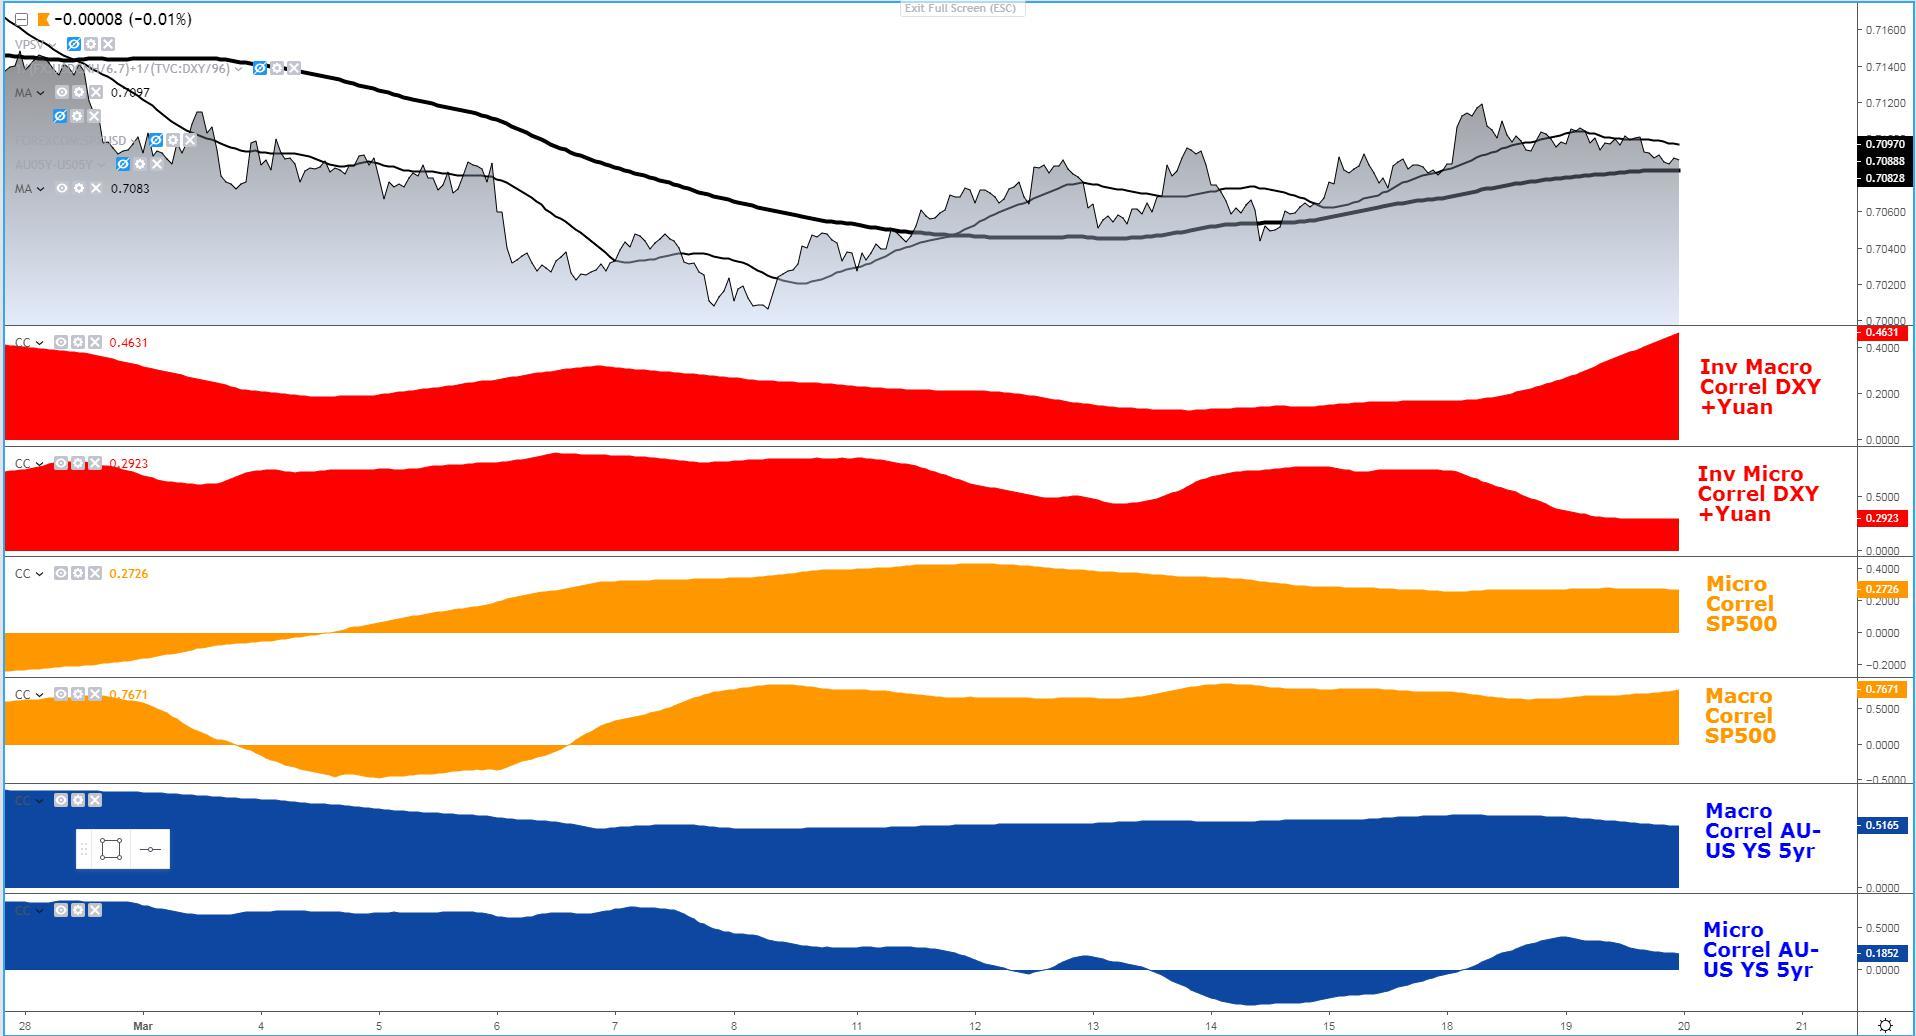
AUD/USD: Shift In Flows Towards Bearish Bias
- Sell-off in Asia is breaking the trendline in the hourly, which has been acting as a guidance of the uptrend ever since March 8th when the pair found a bottom.
- Equities + Aus- US bond yield spread to justify the move lower. The setback in DXY + yuan (both inverted) not yet reflected in the daily MA curve (red) adds further pressure.
- The breakout has led to a fresh downcycle after it broke through a period of 2 days of consolidation, with the trendline breach the final validation of a shift in flows.
- The hourly selling candle in the Aussie is one of the largest in March, setting in motion a change in the market’s psyche towards a potentially lower Aussie.
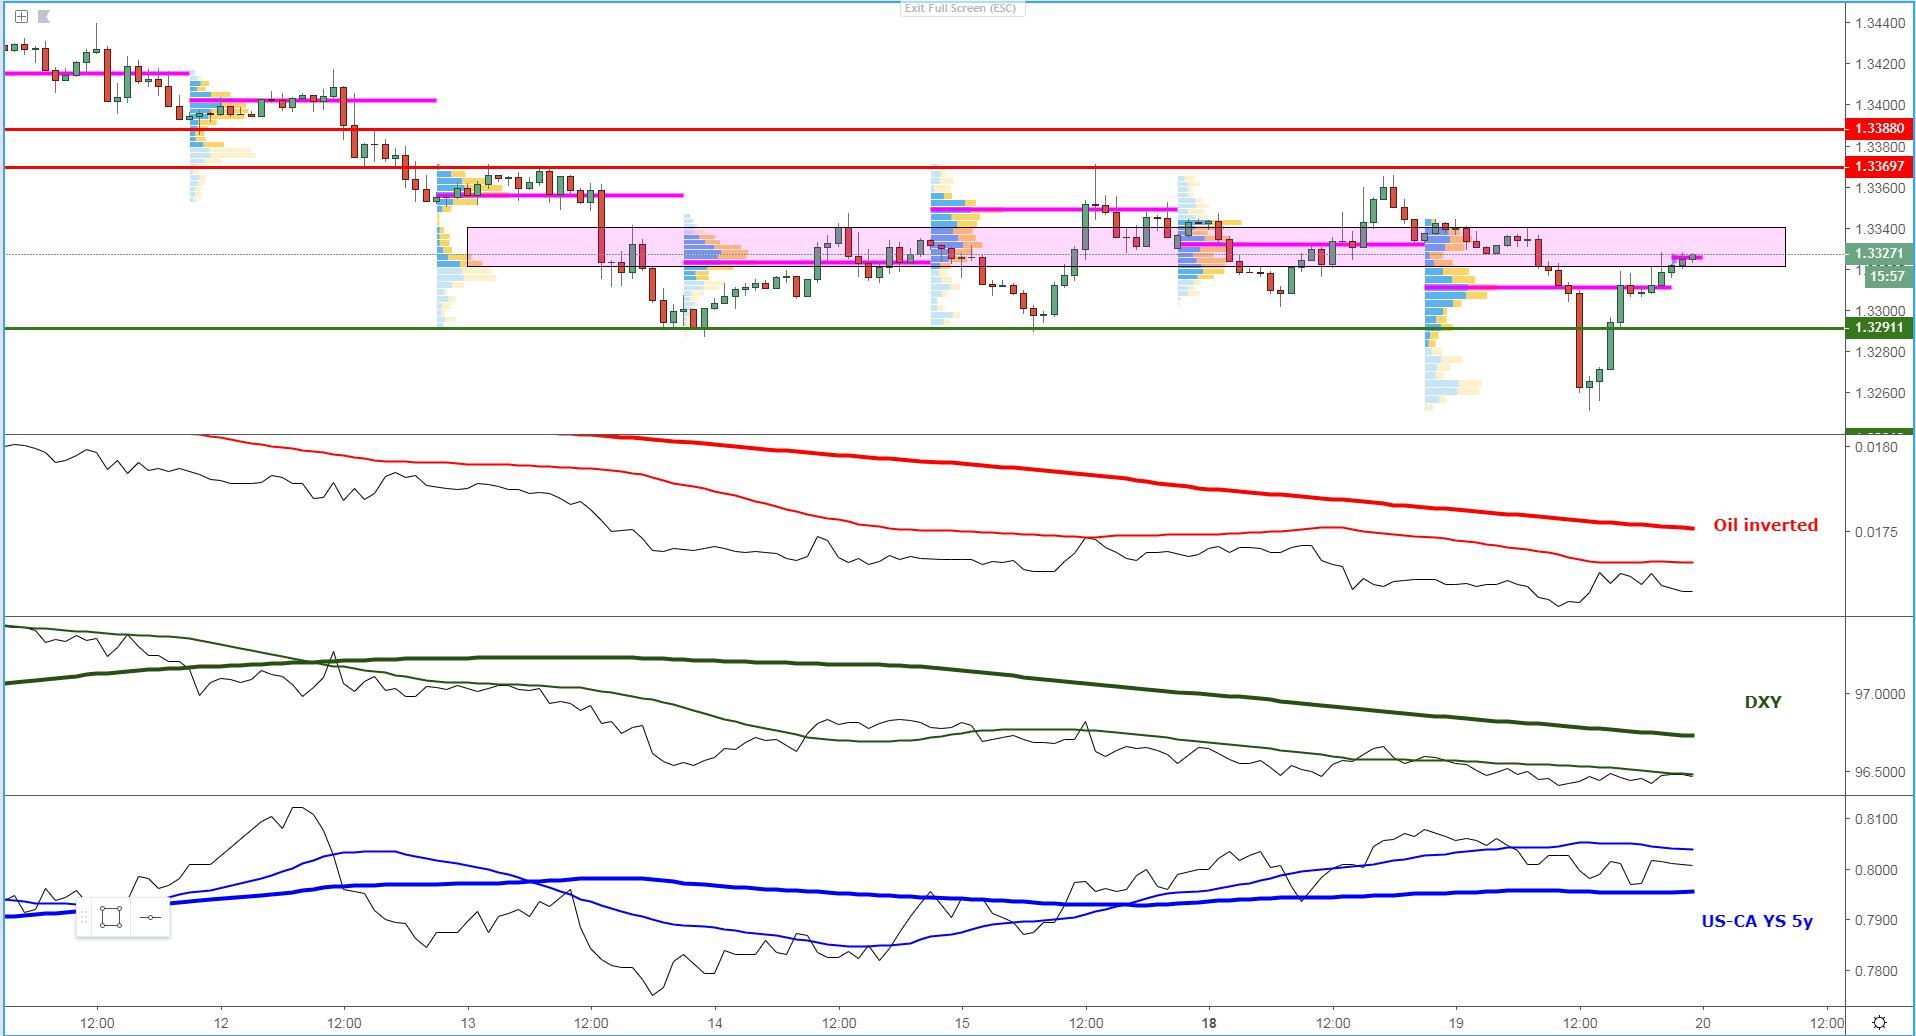
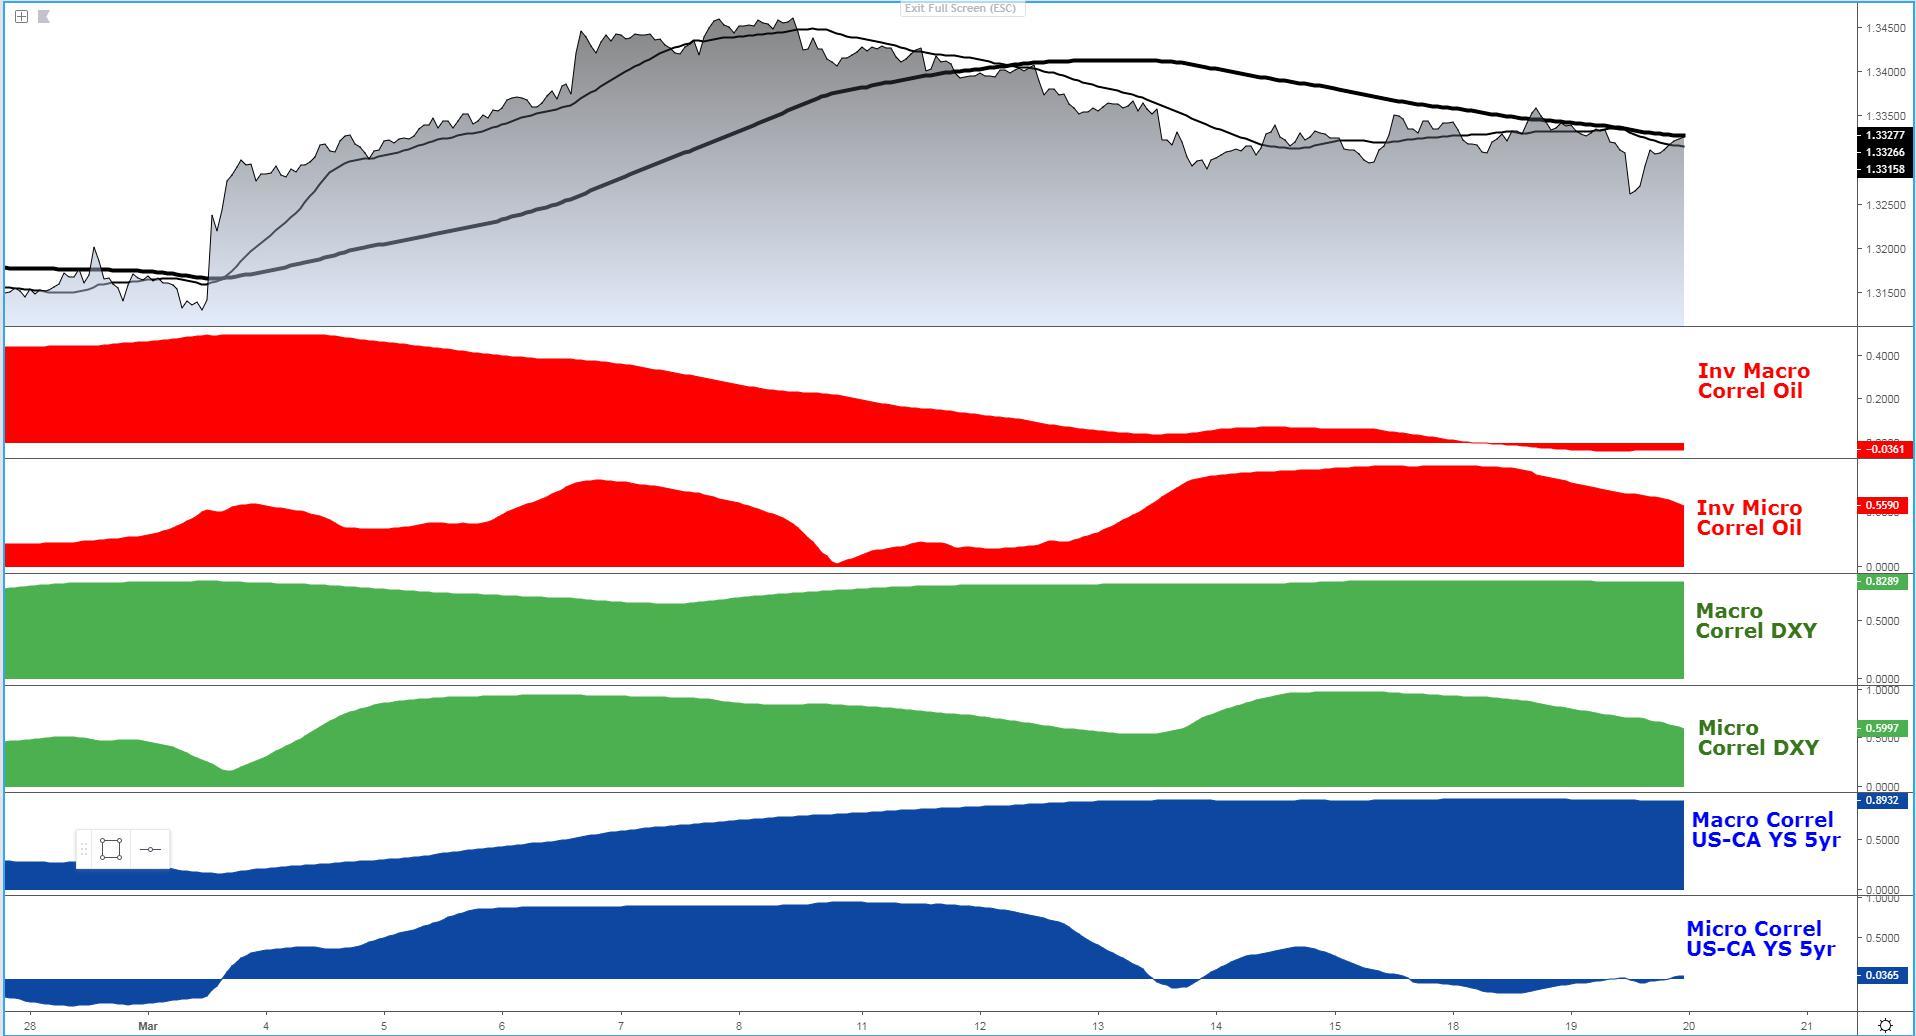
USD/CAD: Fails To Maintain Downside Advantage Sub 1.33
- All micro slopes in intermarket studies look weak, and the same applies for the macro ones taking as reference 1 week worth of data, hence any upside limited.
- The price failed to accept sub 1.33, with the close above the POC. Price likely to struggle at the midpoint of the broken range (magenta rectangle), which is also the POC of the entire range.
- Whenever u see this type of volume profile structure with price retracing most of its drop and the POC is now acting as support, that is not a good omen at all for a sell-side continuation.
- Intermarket is not promoting much higher prices as things stand. Remember, later today there will be a reset and re-evaluation of fair prices in currencies post FOMC.
Important Footnotes
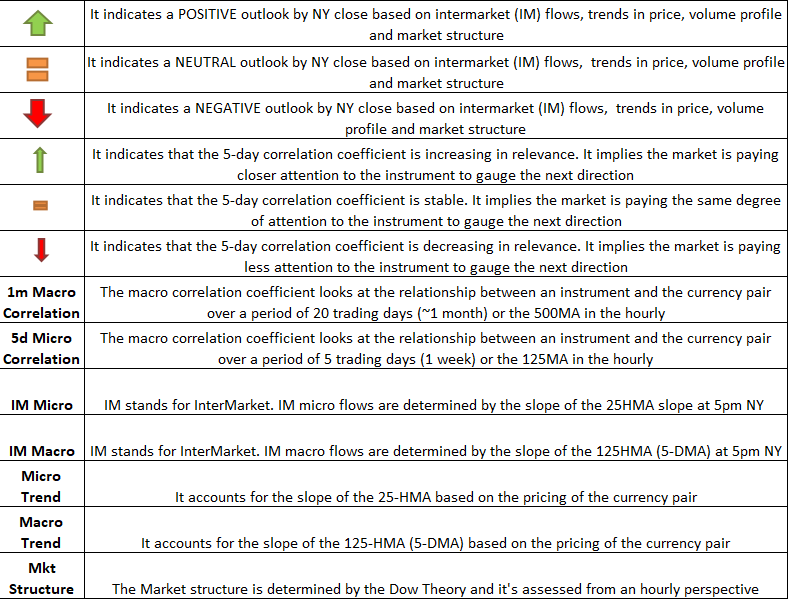
- Risk model: The fact that financial markets have become so intertwined and dynamic makes it essential to stay constantly in tune with market conditions and adapt to new environments. This prop model will assist you to gauge the context that you are trading so that you can significantly reduce the downside risks. To understand the principles applied in the assessment of this model, refer to the tutorial How to Unpack Risk Sentiment Profiles
- Cycles: Markets evolve in cycles followed by a period of distribution and/or accumulation. The weekly cycles are highlighted in red, blue refers to the daily, while the black lines represent the hourly cycles. To understand the principles applied in the assessment of cycles, refer to the tutorial How To Read Market Structures In Forex
- POC: It refers to the point of control. It represents the areas of most interest by trading volume and should act as walls of bids/offers that may result in price reversals. The volume profile analysis tracks trading activity over a specified time period at specified price levels. The study reveals the constant evolution of the market auction process. If you wish to find out more about the importance of the POC, refer to the tutorial How to Read Volume Profile Structures
- Tick Volume: Price updates activity provides great insights into the actual buy or sell-side commitment to be engaged into a specific directional movement. Studies validate that price updates (tick volume) are highly correlated to actual traded volume, with the correlation being very high, when looking at hourly data. If you wish to find out more about the importance tick volume, refer to the tutorial on Why Is Tick Volume Important To Monitor?
- Horizontal Support/Resistance: Unlike levels of dynamic support or resistance or more subjective measurements such as fibonacci retracements, pivot points, trendlines, or other forms of reactive areas, the horizontal lines of support and resistance are universal concepts used by the majority of market participants. It, therefore, makes the areas the most widely followed and relevant to monitor. The Ultimate Guide To Identify Areas Of High Interest In Any Market
- Trendlines: Besides the horizontal lines, trendlines are helpful as a visual representation of the trend. The trendlines are drawn respecting a series of rules that determine the validation of a new cycle being created. Therefore, these trendline drawn in the chart hinge to a certain interpretation of market structures.
- Correlations: Each forex pair has a series of highly correlated assets to assess valuations. This type of study is called inter-market analysis and it involves scoping out anomalies in the ever-evolving global interconnectivity between equities, bonds, currencies, and commodities. If you would like to understand more about this concept, refer to the tutorial How Divergence In Correlated Assets Can Help You Add An Edge.
- Fundamentals: It’s important to highlight that the daily market outlook provided in this report is subject to the impact of the fundamental news. Any unexpected news may cause the price to behave erratically in the short term.
- Projection Targets: The usefulness of the 100% projection resides in the symmetry and harmonic relationships of market cycles. By drawing a 100% projection, you can anticipate the area in the chart where some type of pause and potential reversals in price is likely to occur, due to 1. The side in control of the cycle takes profits 2. Counter-trend positions are added by contrarian players 3. These are price points where limit orders are set by market-makers. You can find out more by reading the tutorial on The Magical 100% Fibonacci Projection