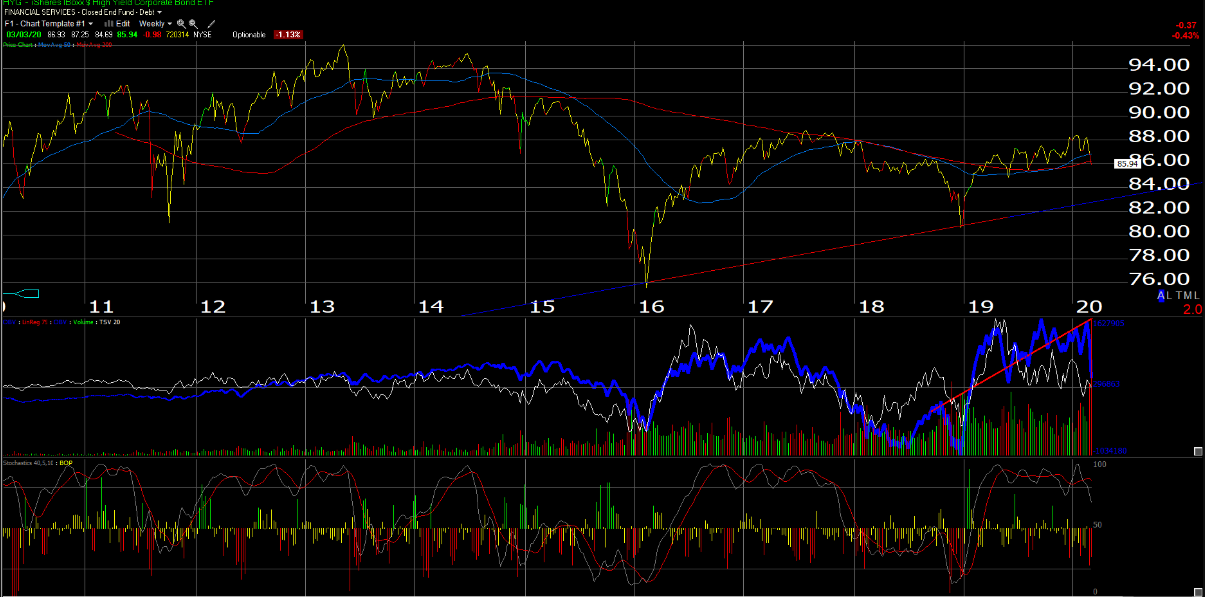
The iShares iBoxx $ High Yield Corporate Bond ETF (NYSE:HYG) is testings it’s 200-week moving average, but is still above the upwardly-sloping trend-line off the Q1 ’16 lows.
With the 50 bp’s fed funds rate reduction by the Fed, high-yield credit is always worth watching. With the Fed rate cut on the last day of July ’19, the high-yield market actually sold off a little as it did again yesterday, only to recover later in 2019.
The June ’19 lows for the HYG are just under $85 ($84.47) and the trend-line off the first quarter, 2016 lows is around $83.

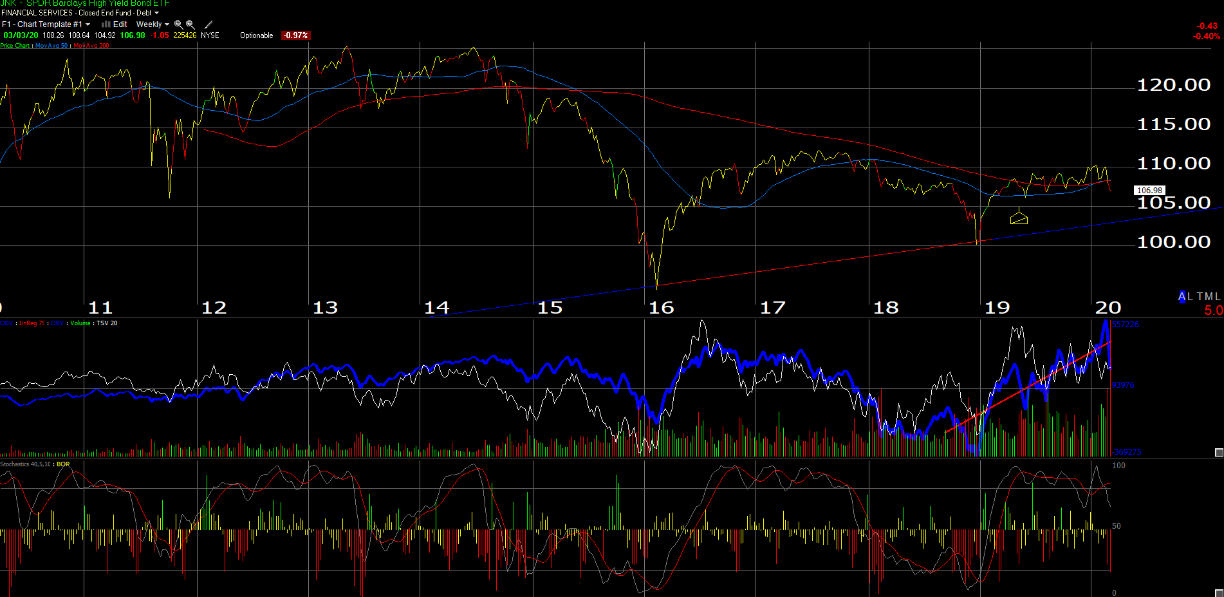
This is a weekly chart of the SPDR® Bloomberg Barclays (LON:BARC) High Yield Bond ETF (NYSE:JNK), another similar corporate high-yield ETF that is watched as a high-yield proxy.
The JNK has traded clearly through its 200-week moving but remains above the upward-sloping trend-line off the Q1 ’16 lows.
Comparison: Both ETF’s have the lion’s share of their credits in the Single-B / Double-BB range, (north of 80% of each ETF) and both have their respective Energy weighting’s around 10%. JNK’s current yield looks a little bit higher than HYG’s at 5.46%, vs 5.02%, with a slightly lower expense ratio too. The Energy sector (you’d think) would be the problem credit sector and the high-yield sector weightings at 10% are far higher than the S&P 500’s market cap weight for Energy at 3.5% – 4%.
Summary / conclusion: The recent downgrade of Kraft-Heinz became an issue for the corporate high-yield bond market since the $30 billion in debt outstanding makes it a big issuer for the junk bond market to absorb. Coupled with Covid-19, the high-yield market is seeing it’s first decent selloff since April – May ’19. Junk had a good year in 2019, returning just over 14%. mirroring the “risk-on” SP 500’s return of +31% for the year.
Even with the 50-bp reduction n fed funds yesterday, fed funds futures another reduction is scheduled for the next meeting on March 18th, 2020, so more liquidity you would think would be a plus for the asset class, even though both the HYG and the JNK finished down on the day yesterday.
Clients are long one high-yield mutual fund today (PIMCO), because it’s tough to get excited with the asset class with current yields of 5% – 5.5%.
Looking at expected defaults rates from Moody’s and Standard & Poor’s the last few years the expected default rates of 2% made sense to own high yield.
Normally, a 10% current yield would be required to own a near-market weight in high yield of 12% to 15%, but with a 10-year Treasury yield of under 1%, if the ETF’s like JNK and HYG would back up to 7% – 7.5%, the high-yield asset class would warrant a bigger allocation, and again that’s assuming that the US economy doesn’t dramatically decelerate.
Just writing to keep an eye on what is happening within the asset class.
Thanks for reading.
