
Hi-Crush Inc. (NYSE:HCR) posted net loss of $268.5 million or $2.67 cents per share in third-quarter 2019 against net income of $27.1 million or 29 cents in the year-ago quarter.
Barring one-time items, adjusted loss per share was 3 cents, which was narrower than the Zacks Consensus Estimate of a loss of 6 cents.
Revenues declined 19.2% year over year to $173 million. However, the figure beat the Zacks Consensus Estimate of $166.4 million.
Total frac sand sold during the quarter was 2,685,736 tons, down 3.2% year over year. Total sales from frac sand fell 9.3% sequentially to $114.2 million in the third quarter.
Contribution margin per ton sold tumbled 54.1% year over year to $10.99 and fell 20.4% sequentially in the third quarter. Average sales price was $43 per ton in the third quarter, down 8.5% sequentially.
Per the company, market conditions softened for frac sand late in the third quarter. This was driven by persistent oversupply as well as further declines in activity, which led to lower pricing and profitability.
Hi-Crush Inc Price, Consensus and EPS Surprise
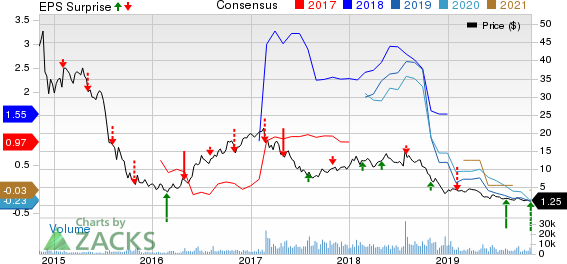
Hi-Crush Inc price-consensus-eps-surprise-chart | Hi-Crush Inc Quote
Operational Update
Truckloads delivered by Pronghorn Energy Services rose 7% sequentially in the third quarter of 2019, including the last mile operations that were acquired on May 7, 2019. As of Sep 30, 2019, Hi-Crush had last mile crews operating in the Permian, Marcellus, Eagle Ford, Mid-Con, Powder River and Bakken regions.
The company is focused on making additional improvements to its proprietary monitoring, tracking and invoicing software suite — PropDispatch. This includes simplification and automation of various processes, including silo inventory tracking.
Moreover, NexStage Systems continued to deploy upgraded silo sets. Additional equipment sales surged 40% sequentially to $1.4 million in the third quarter.
Financial Position
At the end of the third quarter, the company had total liquidity of $95.9 million. This includes $48.4 million of cash along with $47.5 million in available borrowing capacity under its senior secured revolving credit facility (also known as the ABL Facility). As of Sep 30, 2019, its ABL Facility remained completely undrawn.
Long-term debt was $445.2 million at the end of third-quarter 2019 compared with around $444 million in the year-ago quarter.
Net cash provided by operating activities during the first nine months of 2019 was $12.1 million, down from $195.3 million in the year-ago period.
Outlook
Hi-Crush expects sand sales volumes, adjusted EBITDA and contribution margin per ton to decline sequentially in the fourth quarter. Per the company, impacts of E&P budget exhaustion along with other seasonal factors, including demand for frac sand and logistics services, are expected to exert pressure on margins.
The company is expected to continue to deploy last mile and wellsite equipment and crews in 2019 on the basis of recent field trials and customer conversations.
Per management, remaining customer capital budgets as well as holiday schedules and other year-end factors are expected to influence fourth-quarter results. The company expects sand volumes to decline by at least 10% in the fourth quarter. The company expects to continue lowering volumes and other activities, which does not indicate profitability. Overall, this dynamic is expected to persist in 2019.
Zacks Rank & Stocks to Consider
Hi-Crush currently carries a Zacks Rank #3 (Hold).
Some better-ranked stocks in the basic materials space are Kinross Gold Corporation (NYSE:KGC) , Franco-Nevada Corporation (TSX:FNV) and Agnico Eagle Mines Limited (NYSE:AEM) , each sporting a Zacks Rank #1 (Strong Buy). You can see the complete list of today’s Zacks #1 Rank stocks here.
Kinross has an expected earnings growth rate of 210% for 2019. The company’s shares have surged 79% in the past year.
Franco-Nevada has a projected earnings growth rate of 39.3% for 2019. The company’s shares have rallied 46.6% in a year.
Agnico Eagle has an estimated earnings growth rate of 168.6% for the current year. Its shares have moved up 65.5% in the past year.
Just Released: Zacks’ 7 Best Stocks for Today
Experts extracted 7 stocks from the list of 220 Zacks Rank #1 Strong Buys that has beaten the market more than 2X over with a stunning average gain of +24.5% per year.
These 7 were selected because of their superior potential for immediate breakout.
See these time-sensitive tickers now >>
Agnico Eagle Mines Limited (AEM): Free Stock Analysis Report
Kinross Gold Corporation (KGC): Free Stock Analysis Report
Franco-Nevada Corporation (FNV): Free Stock Analysis Report
Hi-Crush Partners LP (HCR): Free Stock Analysis Report
Original post
Zacks Investment Research