Get 40% Off
🎁 Free Gift Friday: Copy Legendary Investors' Portfolios in One ClickCopy for Free

Here’s What’s Eating Away At Gold

Published 02/16/2021, 11:22 AM

Gold is dodging bullets, as it comes increasingly under fire from rising U.S. interest rates and a USD that is poised to surge.

Catching unsuspecting traders in yet another bull trap, gold’s strength early in the week quickly faded. And with investors unwilling to vouch for the yellow metal for more than a few days, the rush-to-exit mentality highlights a short-term vexation that’s unlikely to subside.

Please see below:
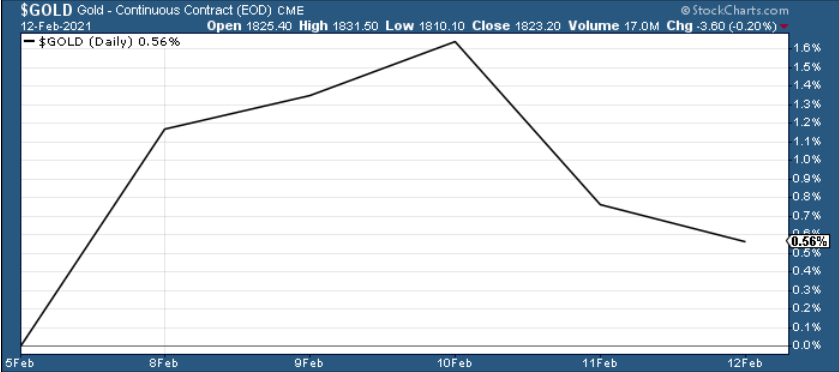
Gold Daily Chart.

Figure 1

Destined for devaluation after hitting its triangle-vertex-based reversal point, the yellow metal is struggling to climb the ever-growing wall of worry.

Mirroring what we saw at the beginning of the new year, gold’s triangle-vertex-based reversal point remains a reliable indicator of trend exhaustion.

And when you add the bearish cocktail of rising U.S. interest rates and a potential USD Index surge, $1,700 remains the initial downside target, with $1,500 to even ~$1,350 still possibilities under the right curcumstances.

Please see below:
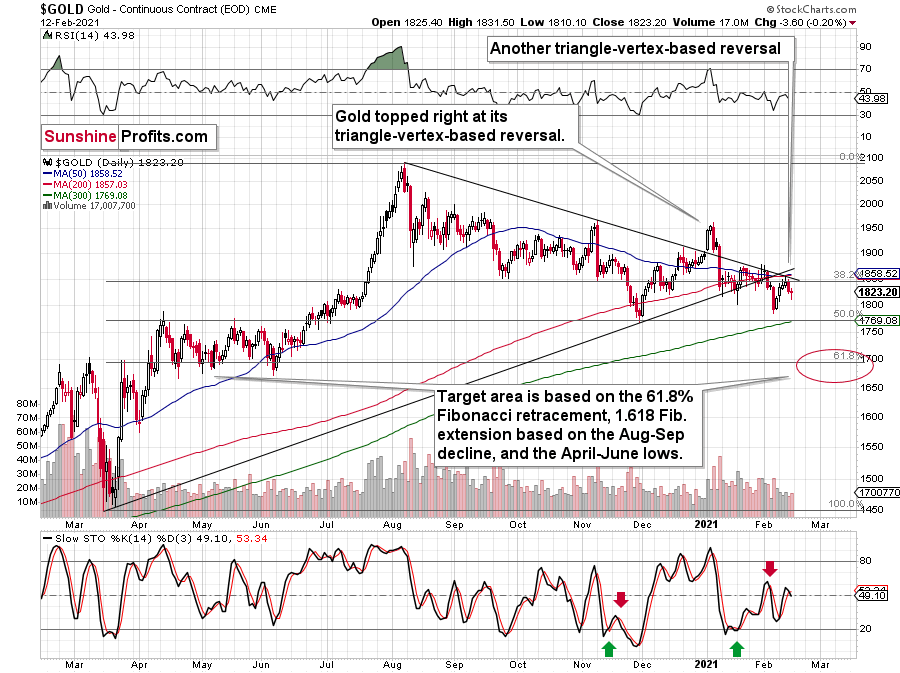
Gold Chart.

Figure 2 - Gold Continuous Contract Overview and Slow Stochastic Oscillator Chart Comparison

To explain the rationale, I wrote previously:

Back in November, gold’s second decline (second half of the month) was a bit bigger than the initial (first half of the month) slide that was much sharper. The January performance is very similar so far, with the difference being that this month, the initial decline that we saw in the early part of the month was bigger.

This means that if the shape of the price moves continues to be similar, the next short-term move lower could be bigger than what we saw so far in January and bigger than the decline that we saw in the second half of November. This is yet another factor that points to the proximity of $1,700 as the next downside target.

3rd party Ad. Not an offer or recommendation by Investing.com. See disclosure here or remove ads .

In addition, as a steepening U.S. yield curve enters the equation, I wrote on Jan. 27 that the bottom, and subsequent move higher, in U.S. Treasury yields coincided with a USDX rally 80% of the time since 2003.
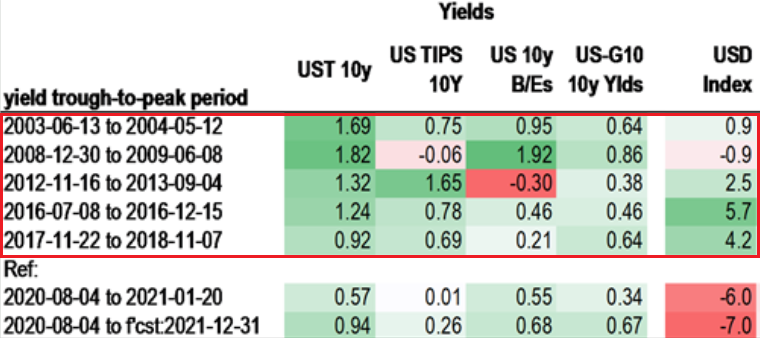
US Treasury Yields.

Figure 3 - Source: Daniel Lacalle

And while the USDX continues to fight historical precedent, on Feb. 12, the U.S. 30-Year Treasury yield closed at its highest level in nearly a year. As such, the move should add wind to the USDX’s sails in the coming weeks.

Please see below:
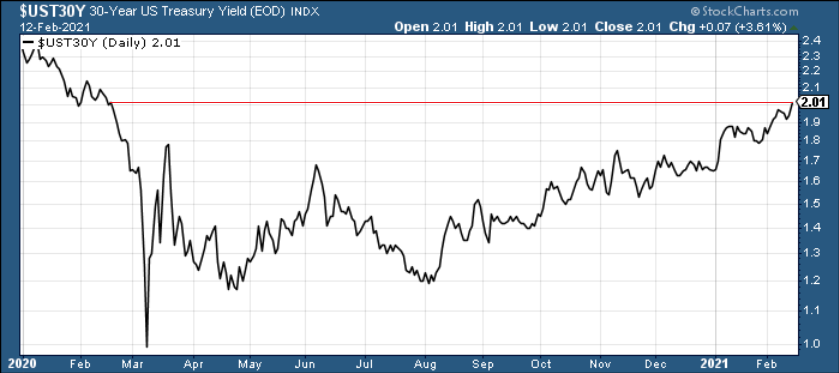
US 30-Year Treasury Yield Chart.

Figure 4

In conclusion, gold is under fire from all angles and dodging bullets has become a near impossible task. With the USD Index likely to bounce off its declining resistance line (now support), a bottom in the greenback could be imminent. Also ominous, a steepening U.S. yield curve signals that the yellow metals’ best days are likely in the rearview mirror. However, as the situation evolves and gold eventually demonstrates continued strength versus the USD Index, its long-term uptrend will resume once again.

Before moving on, I want to reiterate my previous comments and explain why $1,700 remains my target:

One of the reasons is the 61.8% Fibonacci retracement based on the recent 2020 rally, and the other is the 1.618 extension of the initial decline. However, there are also more long-term-oriented indications that gold is about to move to $1,700 or lower.

(…) gold recently failed to move above its previous long-term (2011) high. Since history tends to repeat itself, it’s only natural to expect gold to behave as it did during its previous attempt to break above its major long-term high.

3rd party Ad. Not an offer or recommendation by Investing.com. See disclosure here or remove ads .

And the only similar case is from late 1978, when gold rallied above the previous 1974 high. Let’s take a look at the chart below for details (courtesy of chartsrus.com)Gold Rally In 1970s.
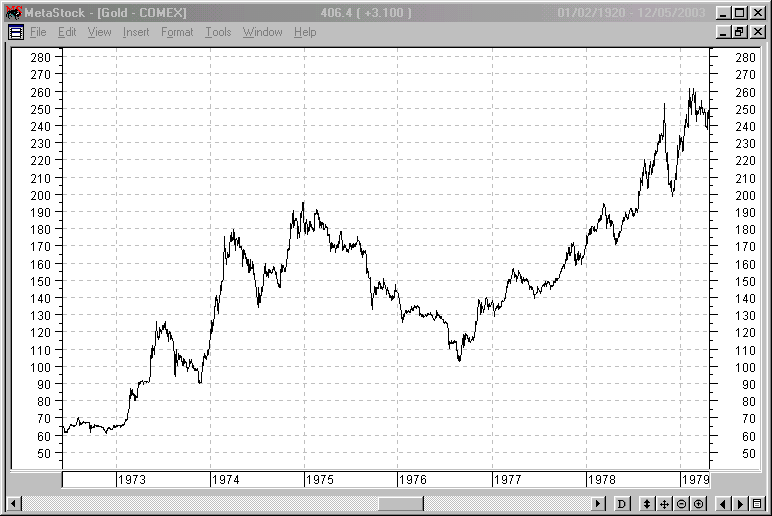
Figure 5 - Gold rallying in 1978, past its 1974 high

As you can see above, in late 1978, gold declined severely right after it moved above the late-1974 high. This time, gold invalidated the breakout, which makes the subsequent decline more likely. And how far did gold decline back in 1978? It declined by about $50, which is about 20% of the starting price. If gold was to drop 20% from its 2020 high, it would slide from $2,089 to about $1,671.
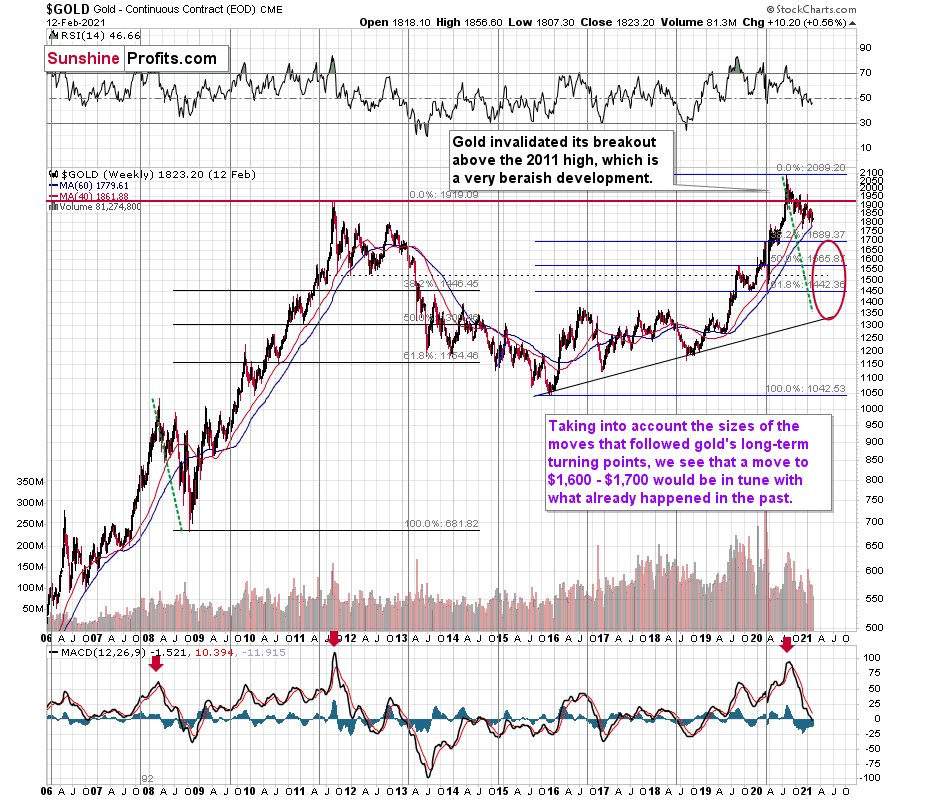
Gold Chart.

Figure 6 - Relative Strength Index (RSI), GOLD, and Moving Average Convergence Divergence (MACD) Comparison

If you analyze the red arrow in the lower part of the above chart (the weekly MACD sell signal), today’s pattern is similar not only to what we saw in 2011, but also to what we witnessed in 2008. Thus, if similar events unfold – with the S&P 500 falling and the USD Index rising (both seem likely for the following months, even if these moves don’t start right away) – the yellow metal could plunge to below $1,350 or so. The green dashed line shows what would happen gold price, if it was not decline as much as it did in 2008.

However, as of right now, my initial target is $1,700, with $1,500 likely over the medium-term. But as mentioned, if the S&P 500 and the USD Index add ripples to the bearish current, $1,400 (or even ~$1,350) could occur amid the perfect storm. ~$1,500 still remains the most likely downside target for the final bottom, though.

3rd party Ad. Not an offer or recommendation by Investing.com. See disclosure here or remove ads .

Latest comments

Current discussion has moved to "Gold’s Downtrend: Is This Just The Beginning?" - the summaries, updates of us two.
UPDATE: The week is almost over and GDX and GDXJ are now both almost certain to confirm their breakdowns below the neck levels of their broad head-and-shoulders patterns. If that happens, the implications will be VERY bearish for the next weeks for the entire precious metals market, not only for mining stocks.
UPDATE: Points made in the article above remain up-to-date, in particular given today's pre-market decline in gold DESPITE USD's weakness.
Przemyslaw Radomski: Consolidated reply to unattended posts. I think that the Roaring Twenties would come first now really - not Kondratieff winter. Credit. Then, we're not in 1929 where the monetary system is tied to, is gold - with implications for the miners through PMs confiscation. The last deflationary episode we saw, was Feb-Mar 2020 - central banks clearly indicate they won't allow that to repeat now. I don't agree with the take on velocity of money - it's that when it rises, inflation (bubbles) have an easier time forming. I've been successfully using my own unique mix of short-term charts (technicals) and macroeconomics to keep nailing the moves in stocks, metals and oil, and will be continuously updating my positions, including for the dollar to keep being under pressure.
I agree. I do not buy the Kondratieff cycles, and, anyway, it's very very difficult to identify them before they occur. With COVID+Presidential Elections (and potential disputed elections) there was a real opportunity to see a very clear "deflationary bust". But all the central banks are now very much coordinated and they reacted immediately with a sort of war response printing like "no tomorrow", therefore it looks that the critical deflation has been smoothed out, using "future value of money" as a sacrifice. Also Harry Dent (among others) predicts this sort of "deflationary bust", but I do not see triggers for the forthcoming years where the monetary system will remain accommodative for up until 2023. And as soon as vaccines will be rolled out the people will start spending, yes, people might take some money out from stocks, etc, but, as far as earnings from companies will keep on rising, I do not see a crash. Maybe valuations will remain somehow flat for a certain period.
 Kondratieff cycles are the longest-term ones. No precise timing methods, but elegant concepts that you however can't rely on ad absurdum. You're reading my words about central banks not allowing deflation to happen - precisely what I have written in today's analysis, soon to be hopefully here as well. Harry Dent was talking deflation theme also in 2010, he is in a way as consistent as this author... 2021 will be a good year for stocks, 2022 probably as well, but the real gains (I mean real economy now) would be around 2024. That's my way of working with shorter "cycles".
When someone states he or she knows the price of something is going to rise or drop by a big margin and he or she is writing very very long (trying hard), do the opposite is usually correct.
Hold your gold, it won't be down for long time, don't let central banks have their way🤣🤣🤣
As far as physical gold is concerned - the one that one holds as insurance capital - I'm on the same boat. As far as trading is concerned, however, it's a different matter.
depend in perspective of protection against inflation. if centralbanks are running behind inflation because they wanted inflation above 2% before any move, chance of running after is high. so gold is the best orotection.
Naturally - I agree - gold is excellent protection against "systemic failure", hyperinflation and against "all *****breaks loose" situations. And it's likely to perform incredibly well over the course of the next several years. However, based on technical (emotional) and cyclical factors, it's likely to decline first.
In today's analysis, I discuss the ways and prospects of inflation evolution, now. Gold is refusing to decline palpably - because it doesn't want to. This is similar to the internal strength since the Aug 2018 bottom, and the subsequent price path over the Dec 2018 FOMC and into the spring. The metals will perform much better than you think.
nifty prize
time for gold and silver (and all commodities) to explode higher...
From 1974 to 1976 the main reason because gold retraced was due to the fact that the inflation collapsed by more than 5 points, then it picked up again from 1976 to 1980, a new record high for inflation and a new record high for gold. Simple as that! In this case, the notion of inflation has changed many times, because governments are doing their best to hide it as much as possible. But, with all the checks and furlough scheme that this time will be out to the low-mid class, there are very high chances that, once, that the Pandemic will be over we'll see a higher velocity of money, and with the current money supply there are very high chances to see higher inflation; especially starting from a "hypothetic" 1.5% (basement). Accounting for the fact that Fed is now targeting average inflation of 2%, and they are willing to see it running hot for some years.  From the standpoint that the discount rate is now much lower, that makes gold very attractive, as the other commodities.
Exactly, CPI is the tail wagging the dog, like blaming rain on the people with umbrellas. One step ahead indeed is best.
Thank you for your comments. I agree that the points that you're making support the bullish case for gold in the next few years (or even after a year from now). And I'm very bullish on gold with regard to the next few years. However, what you wrote is not something that would prevent gold from declining in the short run. Over this period, the fundamentals won't matter that much. Did fundamentals or inflation statistics change dramatically between Oct 10, 2008 and Oct 24, 2008? Or any fundamental information regarding silver between Apr 7, 2004 and Apr 22, 2004? Absolutely not. And yet, in both cases gold and silver declined substantially in less than one month.  Markets move in broader trends and they adhere to various cycles, even if the fundamentals don't change. Based on the upcoming USDX strength and the emotional=technical factors, gold is now likely to move much lower in the next several weeks or so. In fact, it just moved to new yearly low earlier today.
 I've been refuting the $1700, $1500, $1350 targets in my daily PMs analyses - well argued cases each day. What - are we facing a 2008 liquidity crunch, Lehman moments before, Treasury yields falling? You can't compare this era to the 2004 snippet or 1978 analogies, no. The dollar is moving down, not higher - I have called for it to roll over in summer 2020, and have also called the corrective 2021 as largely over now. The dollar is & will be on the defensive throughout 2021 - a dollar bull market notion is as wrong as a deep crash in the metals.
$1350 with all these money printing and stock at all time high and gold US Mint sales is having all time high?? Including Silver that is squeezed to the max. Do you have common sense? How can silver will be at $50 and gold is down at $1350? Have you ever think about the gold/silver ratio? If gold is $1350 and silver back to $15 do you think it is connected to the reality (physical supply & demand) at all?
Shortly after the SLV ETF was introduced, the silver price collapsed. Why would it do so given this radical improvement in ease of making investments in silver and dramatic increase in the demand for the metal? The market buys the rumor and sells the fact. The #silversqueeze movement triggered substantial interest in the white metal, but I doubt if it manages to prevent silver's decline along with gold when the USD Index rallies. Technically, the latter is already after a verified breakout, and it seems that we're about to enter the Kondratiev winter. That's very bullish for the PMs, but NOT very initially, when the demand for cash is most important. Did gold have any good reason to decline in 2020 or 2008? The same with gold stocks after the 1929 top? Not at all - but all these sharp moves happened. Yes, PMs soared shortly thereafter, but not without failing dramatically first.
Even the SLV prospectus says that at times, it needn't track silver prices. The SLV introduction story is a different one, and we both know it. The white metal will rise, squeeze or not. I have commented earlier already on why an inertia break of steep lines doesn't herald a trend change. Have the dollar bullish spirits returned? Beating the prior decline? Absolutely not.
I ask, how relevant are the real world facts of today to 1978? Not even the pace of money creation, debasement compares. Not fiscal policy, not the pace of commodity inflation. And this is an environment for an alleged dollar bull run? Widening trade deficit? And gold cited at $1,500 or even $1.350 under some circumstances? This doesn't add up in our trillions unsaturated world. Even as regards the pressure of rising long-dated Treasury yields, I've been presenting proof in my daily PMs & stocks analyses, that their influence is on the relative wane. Decoupling. Silver and platinum leading higher. Bullish signals from GDX, GDXJ and SIL. No crash.
 that's what I wrote - gold went sideways till half of 2019..and Covid accelerated gold's run-up in 2020, well not Covid alone but policies following it..
 however, is gold a commodity? www.sunshineprofits.com/gold-silver/free-alerts/gold-commodity-or-currency/
 Clearly perceiving the economic realities prior to your 1H 2019 mark, the sideways action was actually bullish in overall implications. Gold was in an undeniable (well, undeniable) bull run well before anyone heard corona. Given how much I have universally written for SP, this link is very redundant - also for other commenters who grasp the realities clearly. Please don't mix my words - I said we're in a commodities supercycle. I haven't said that gold is a commodity. I simply look at everything to drive profitable decisions and conclusions (stocks, metals, commodities, currencies) - and that includes the paths of progressing inflation too.
Risk Disclosure: Trading in financial instruments and/or cryptocurrencies involves high risks including the risk of losing some, or all, of your investment amount, and may not be suitable for all investors. Prices of cryptocurrencies are extremely volatile and may be affected by external factors such as financial, regulatory or political events. Trading on margin increases the financial risks.
Before deciding to trade in financial instrument or cryptocurrencies you should be fully informed of the risks and costs associated with trading the financial markets, carefully consider your investment objectives, level of experience, and risk appetite, and seek professional advice where needed.
Fusion Media would like to remind you that the data contained in this website is not necessarily real-time nor accurate. The data and prices on the website are not necessarily provided by any market or exchange, but may be provided by market makers, and so prices may not be accurate and may differ from the actual price at any given market, meaning prices are indicative and not appropriate for trading purposes. Fusion Media and any provider of the data contained in this website will not accept liability for any loss or damage as a result of your trading, or your reliance on the information contained within this website.
It is prohibited to use, store, reproduce, display, modify, transmit or distribute the data contained in this website without the explicit prior written permission of Fusion Media and/or the data provider. All intellectual property rights are reserved by the providers and/or the exchange providing the data contained in this website.
Fusion Media may be compensated by the advertisers that appear on the website, based on your interaction with the advertisements or advertisers.
© 2007-2024 - Fusion Media Limited. All Rights Reserved.