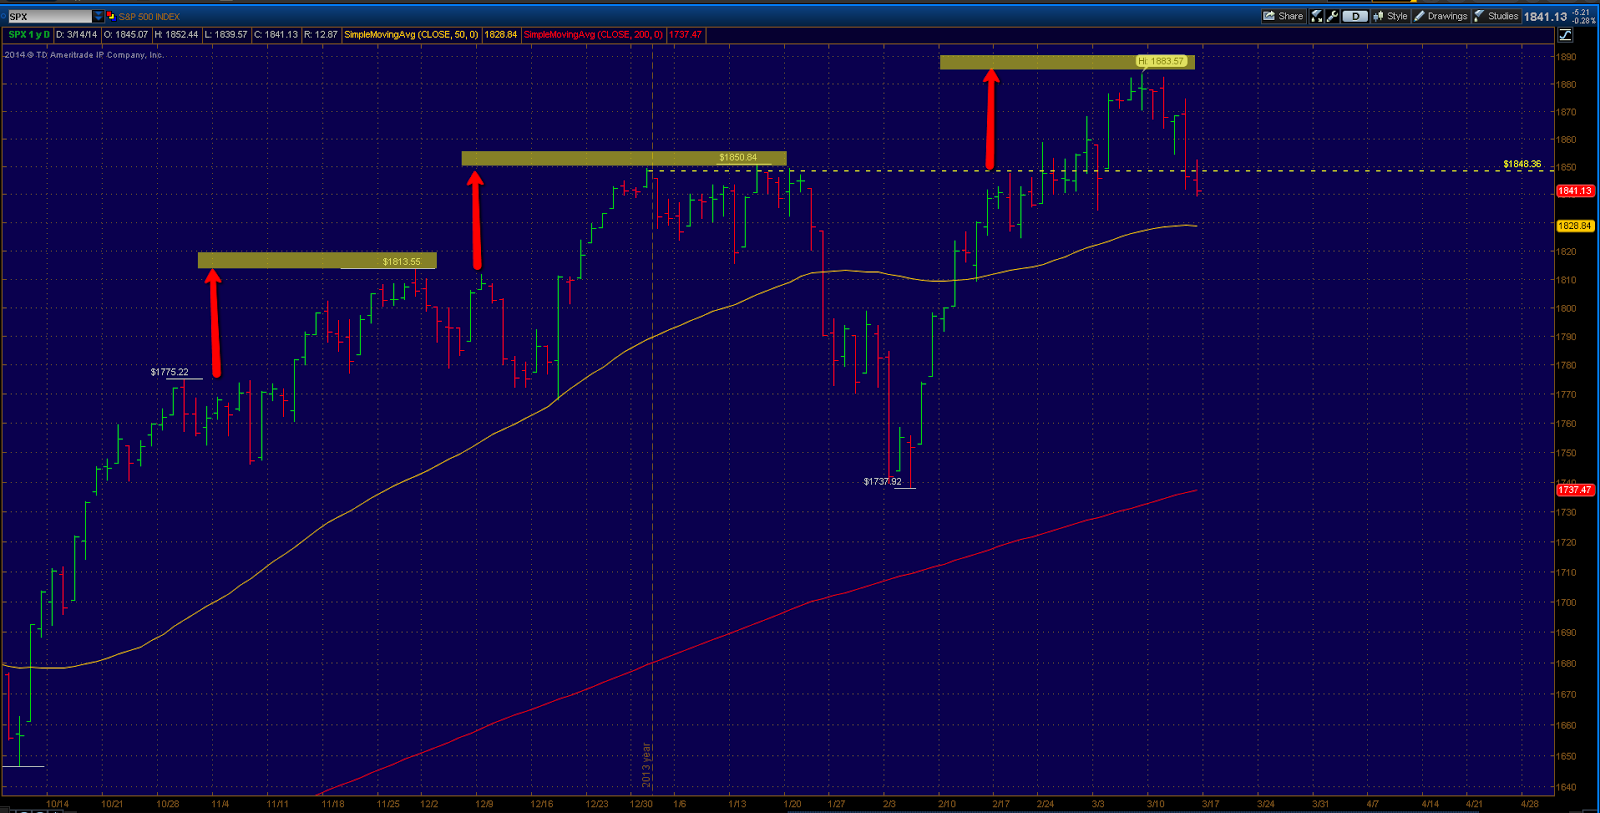
The S+P 500 is now 2.25% off it's all time highs as concerns over China growth, Russia, future monetary policy, among others, abound. Recent history has shown the S+P 500 put in a higher high on average of about 35 points above its previous highs (as denoted on the chart above). This pattern seems to be continuing as Friday's close has completely wiped out all the gains that came about last week when, at that time, a possible diplomatic solution to the situation in Crimea seemed possible.
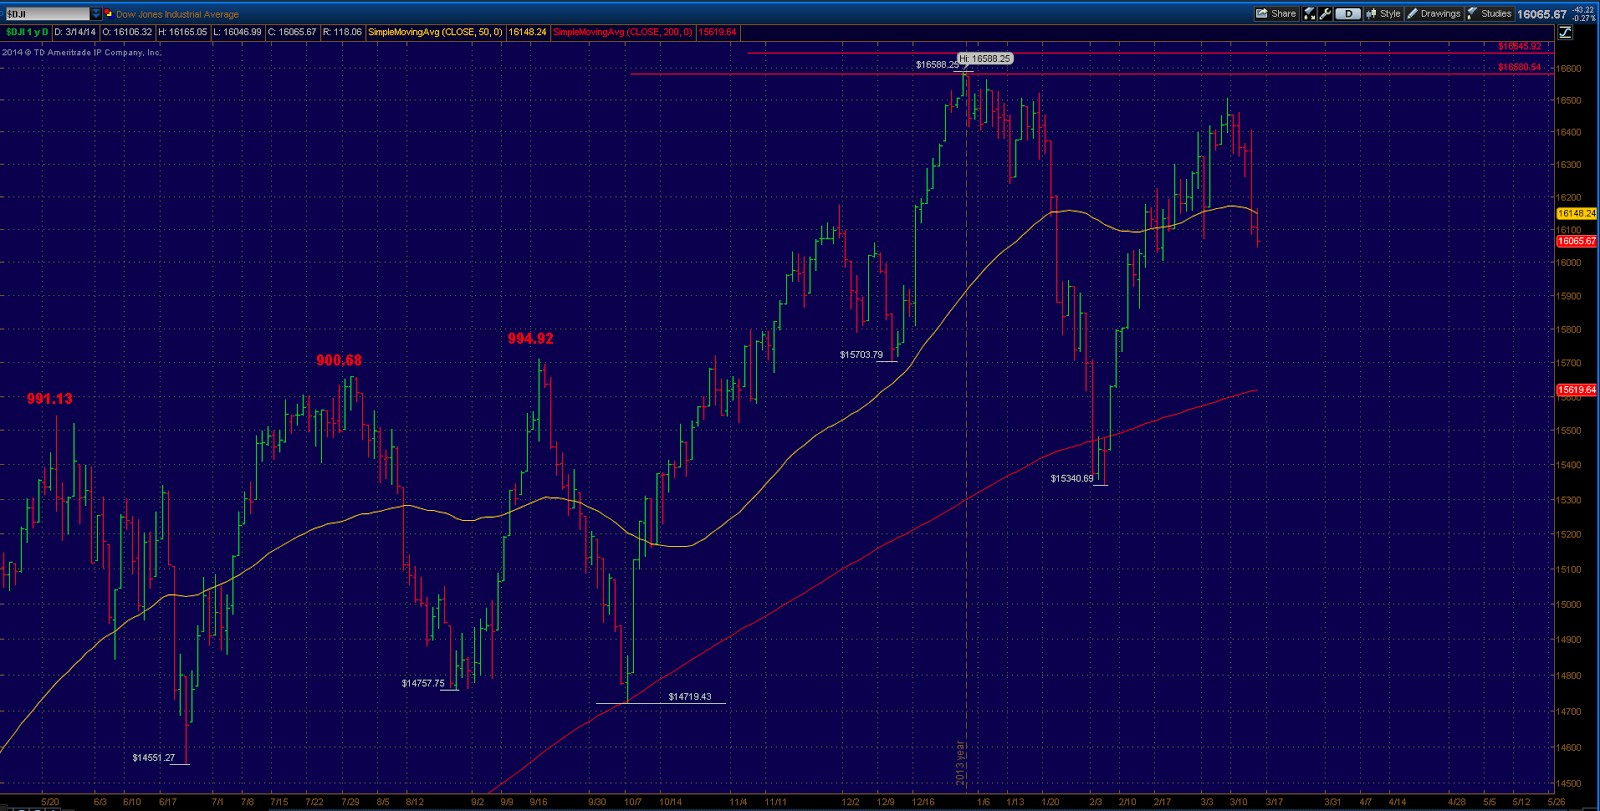
The situation in the Dow Jones Industrial Average appears even more short term bearish as the average closed below the low of it's previous week after retested the long term resistance area once again, an area we have pointed out beforehand
numerous times. Perhaps this is signaling the beginning of a short term trend change.
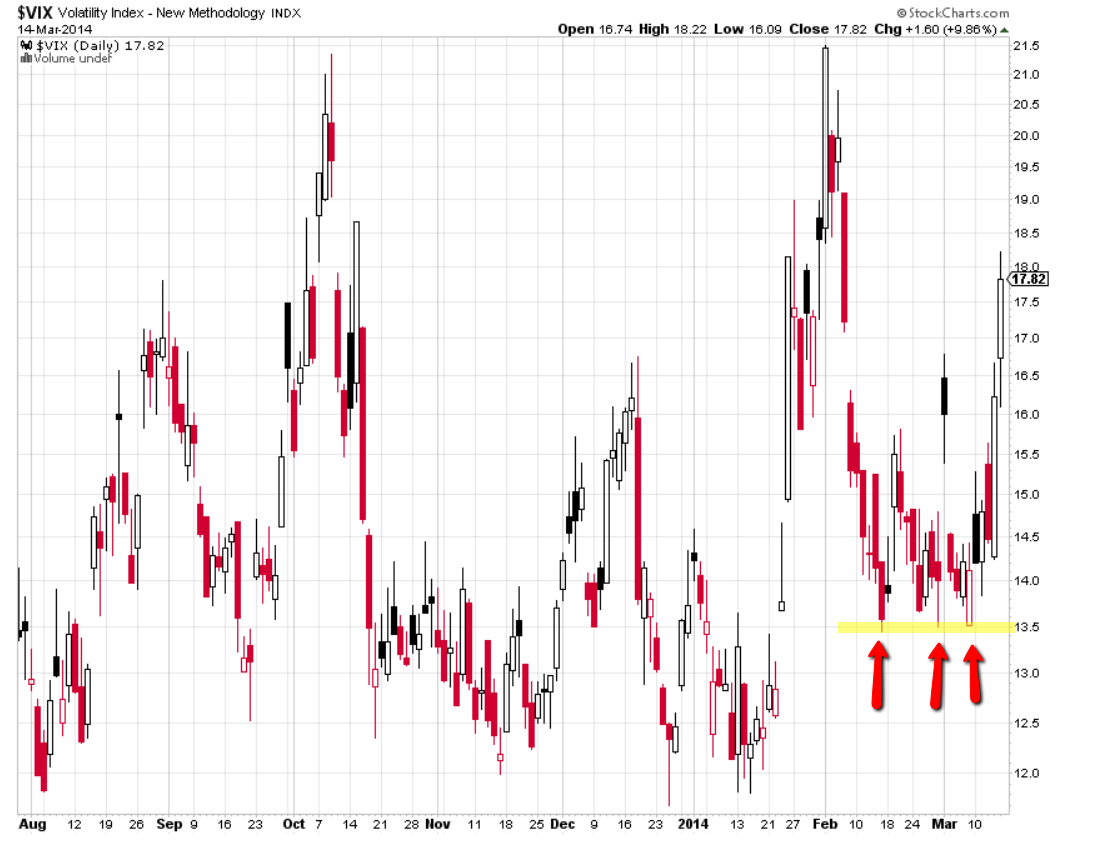
We saw a sharp spike in volatility and put protection as the VIX found support on 3 separate occasions in the last month at the 13.50 level. It's quite possible we will once again test the upper end of this range in the 20-21 area before it's finished.
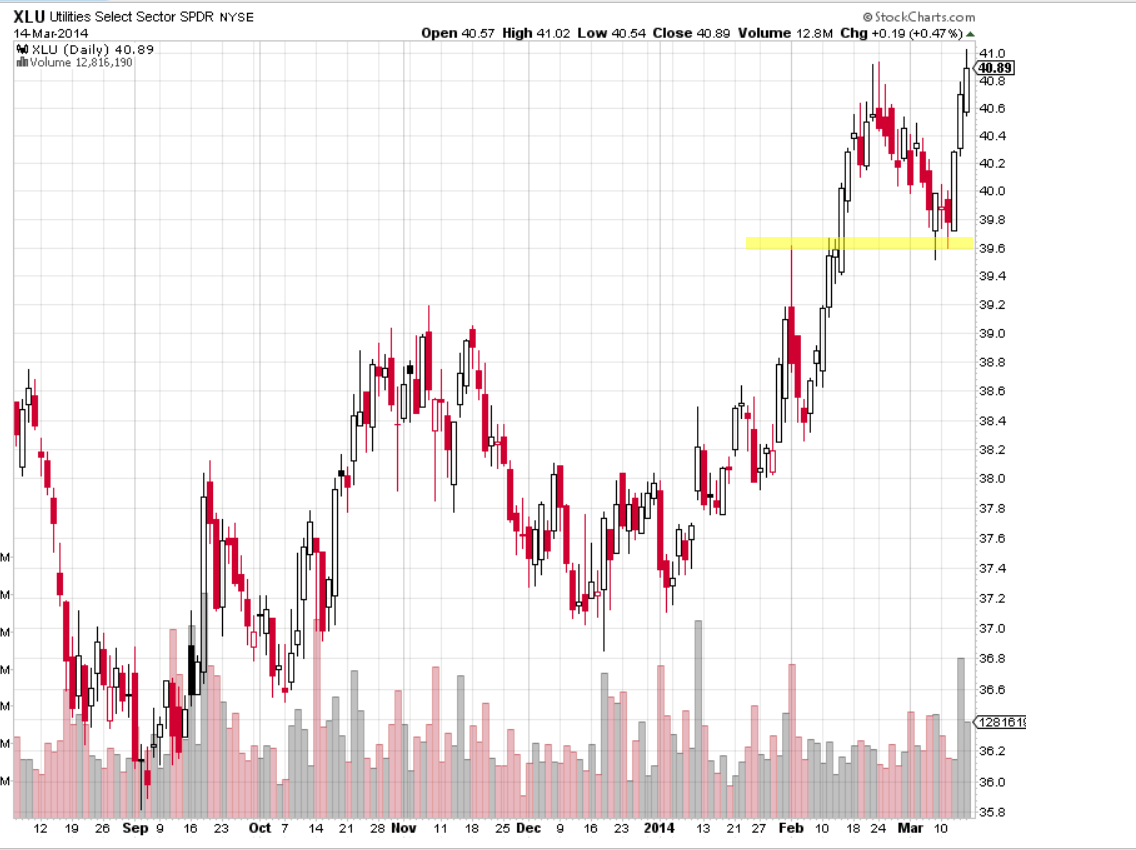
One of the bright spots has been Healthcare and Utilities. The Utilities sector price chart, above, shows how it's bucked the trend of the broader market by finding support early in the week and rallying to a new closing high.
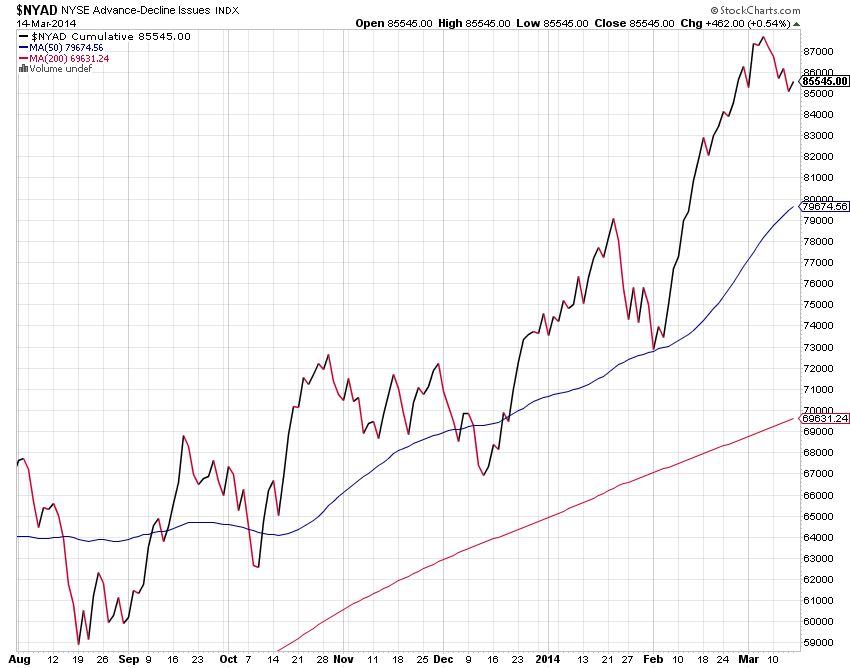
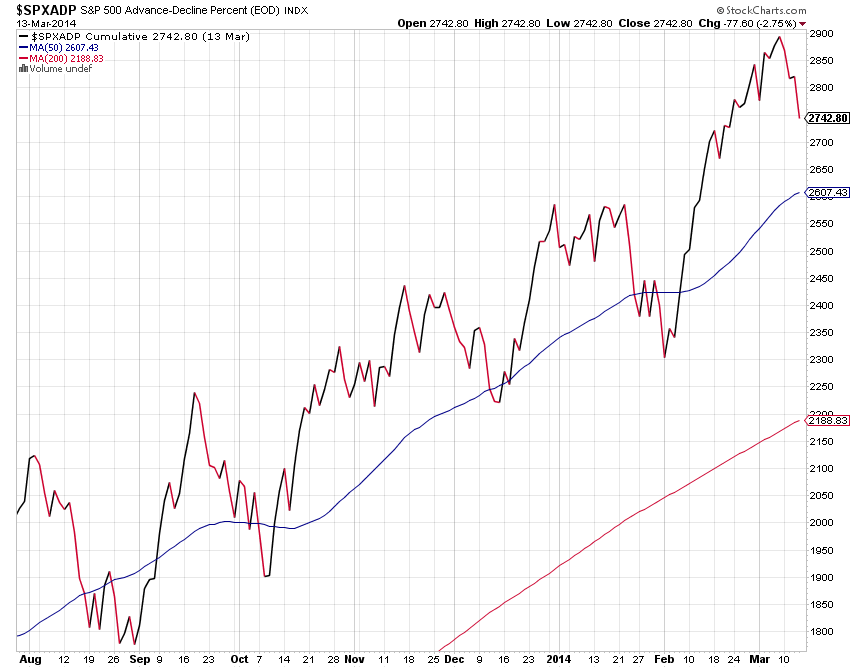
The advance - decline lines of both the New York Stock Exchange and the S+P 500 index remain in strong up trends above their 50 and 200 day moving averages and prior swing highs.
3rd party Ad. Not an offer or recommendation by Investing.com. See disclosure
here or
remove ads
.
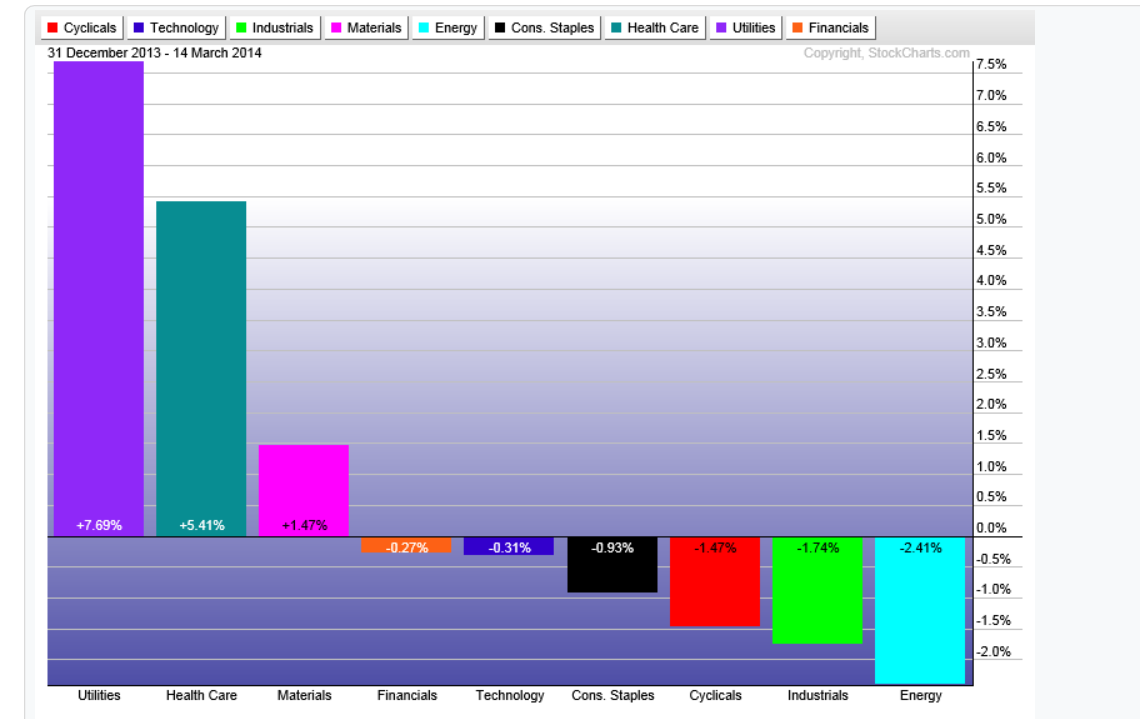
The sector performance year to date continues to show investors risk appetite to be light as the majority of the gains come from the Utilities and Healthcare sector, mainly considered "risk off" or more "risk averse" investments.
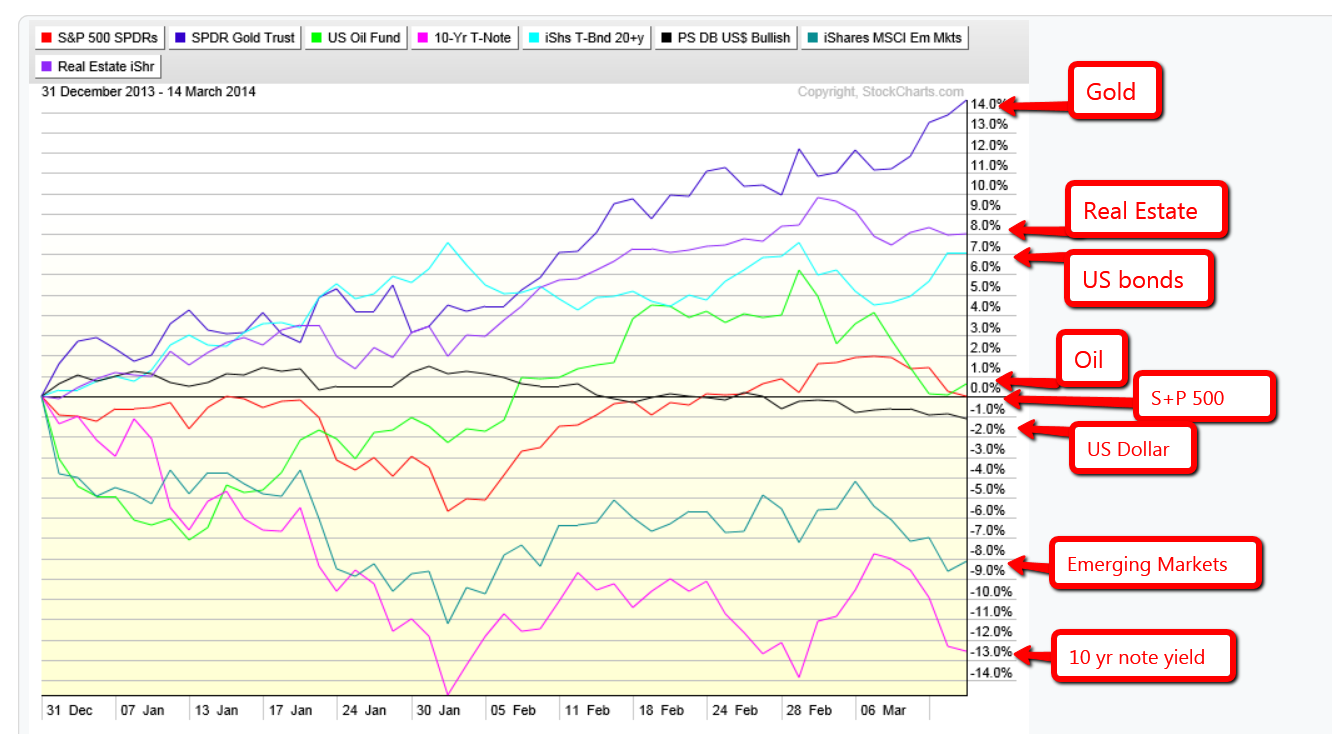
The year to date performance by asset class reinforces this "risk off" theme as Gold and Treasury Bonds come in as 2 of the top 3 performing asset classes so far in 2014. I've added Real Estate by using the exchange traded fund IYR. In fairness and keeping a balanced approach we must ask ourselves, is this recent performance just a "value play"? (as Gold and Bonds were two of the worst performers in 2013 and Utilities was the worst performing sector for 2013) Or the beginning of a larger risk averse theme that often times precedes a significant market correction?
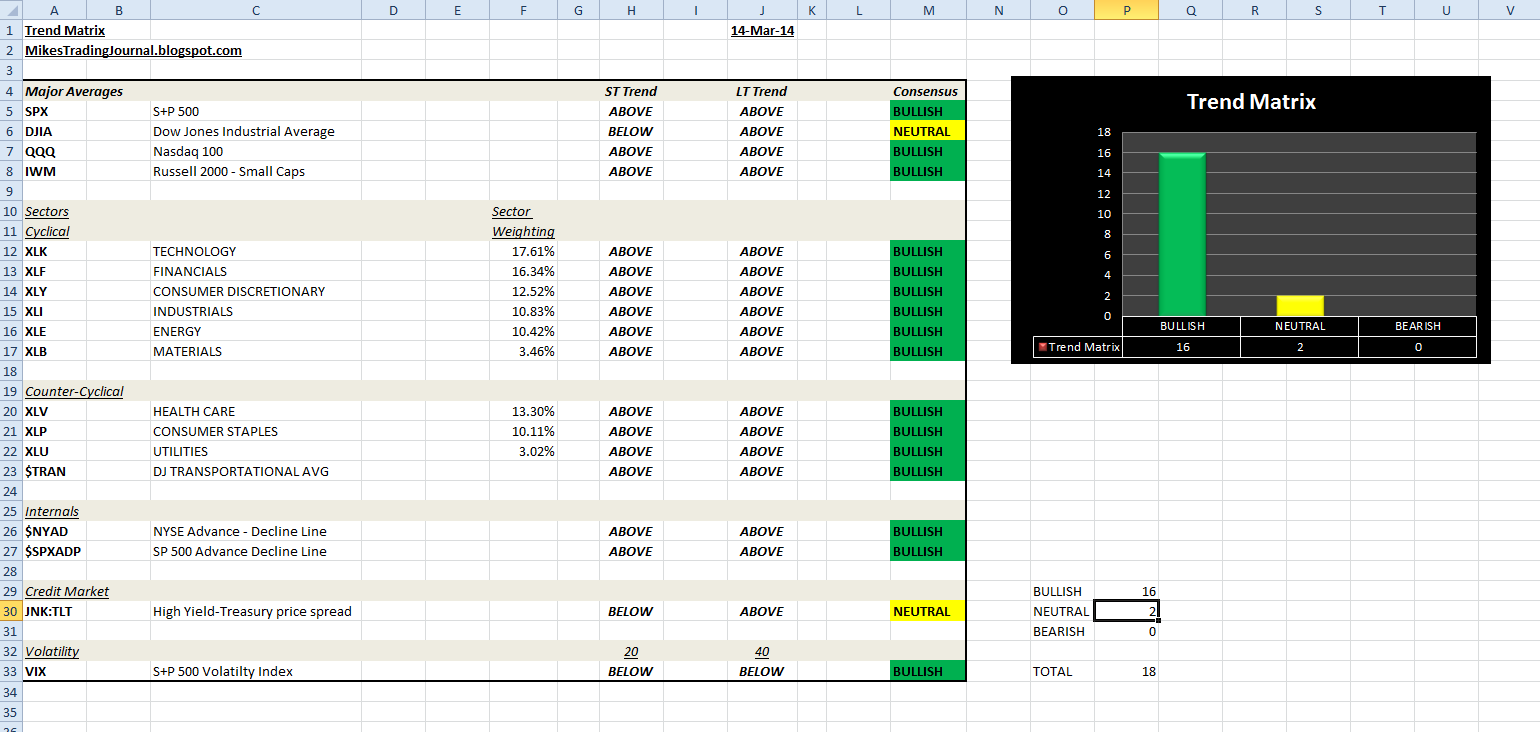
The trend matrix this week continues its bullish stance as 16 out of the 18 components remain bullish with 2 neutral. The best advice for most investors (especially new ones) is to follow the trend and to not get too caught up in all the noise surrounding you, put your blinders on so to speak. As an investor just try to focus on what you can control and quantify (which is current market data).
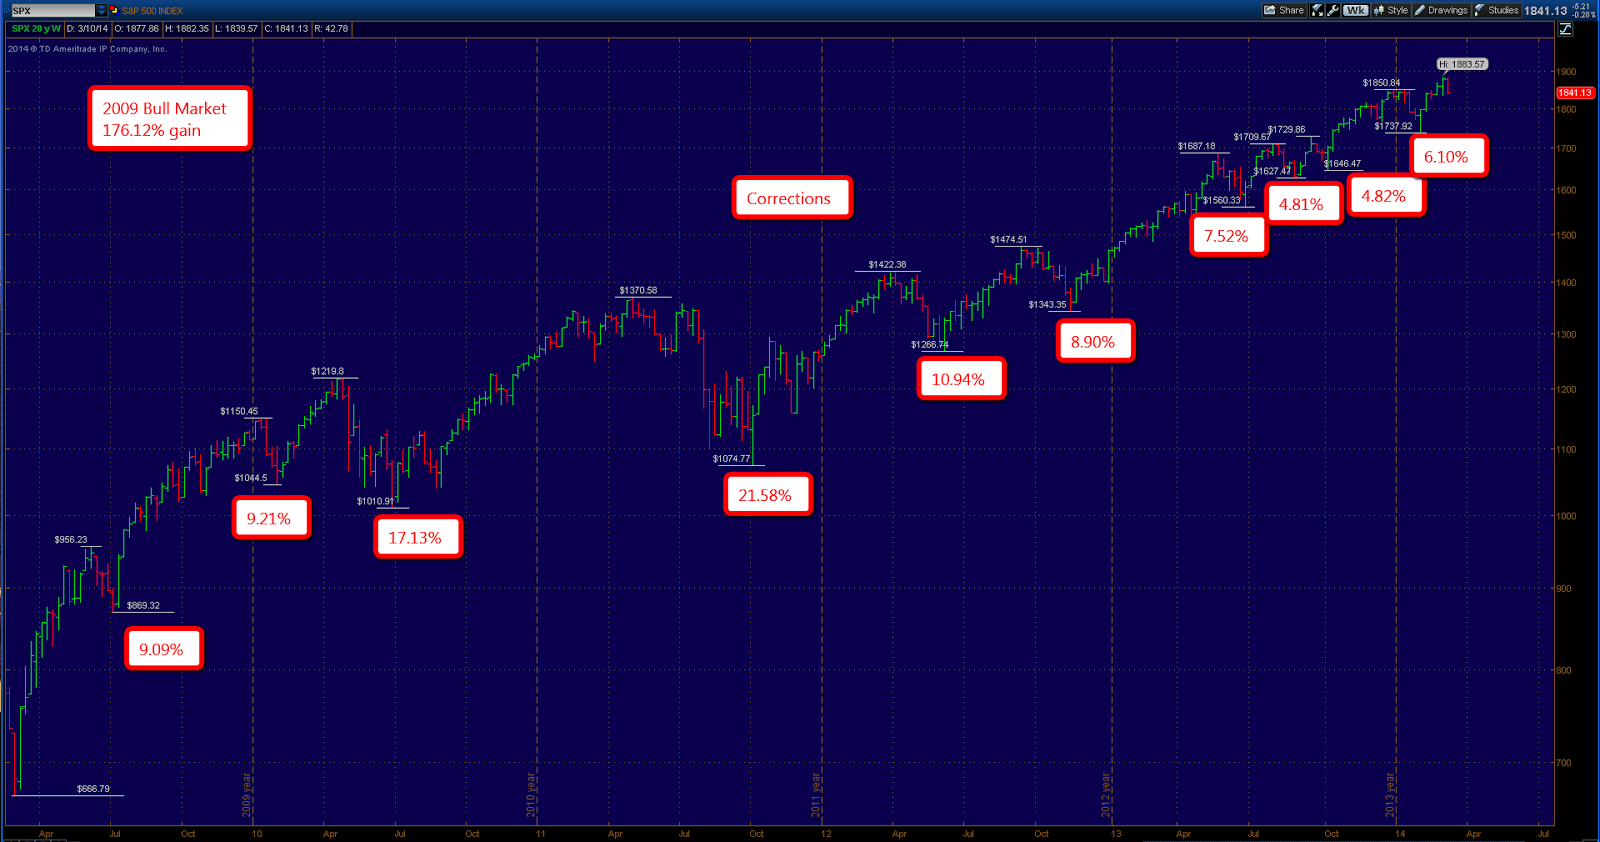
In conclusion, we have come to the fifth anniversary of the bull market that began in 2009. The last major bull market we had ended at it's 5th year but that by itself doesn't mean it is going to happen to this one as well.
3rd party Ad. Not an offer or recommendation by Investing.com. See disclosure
here or
remove ads
.
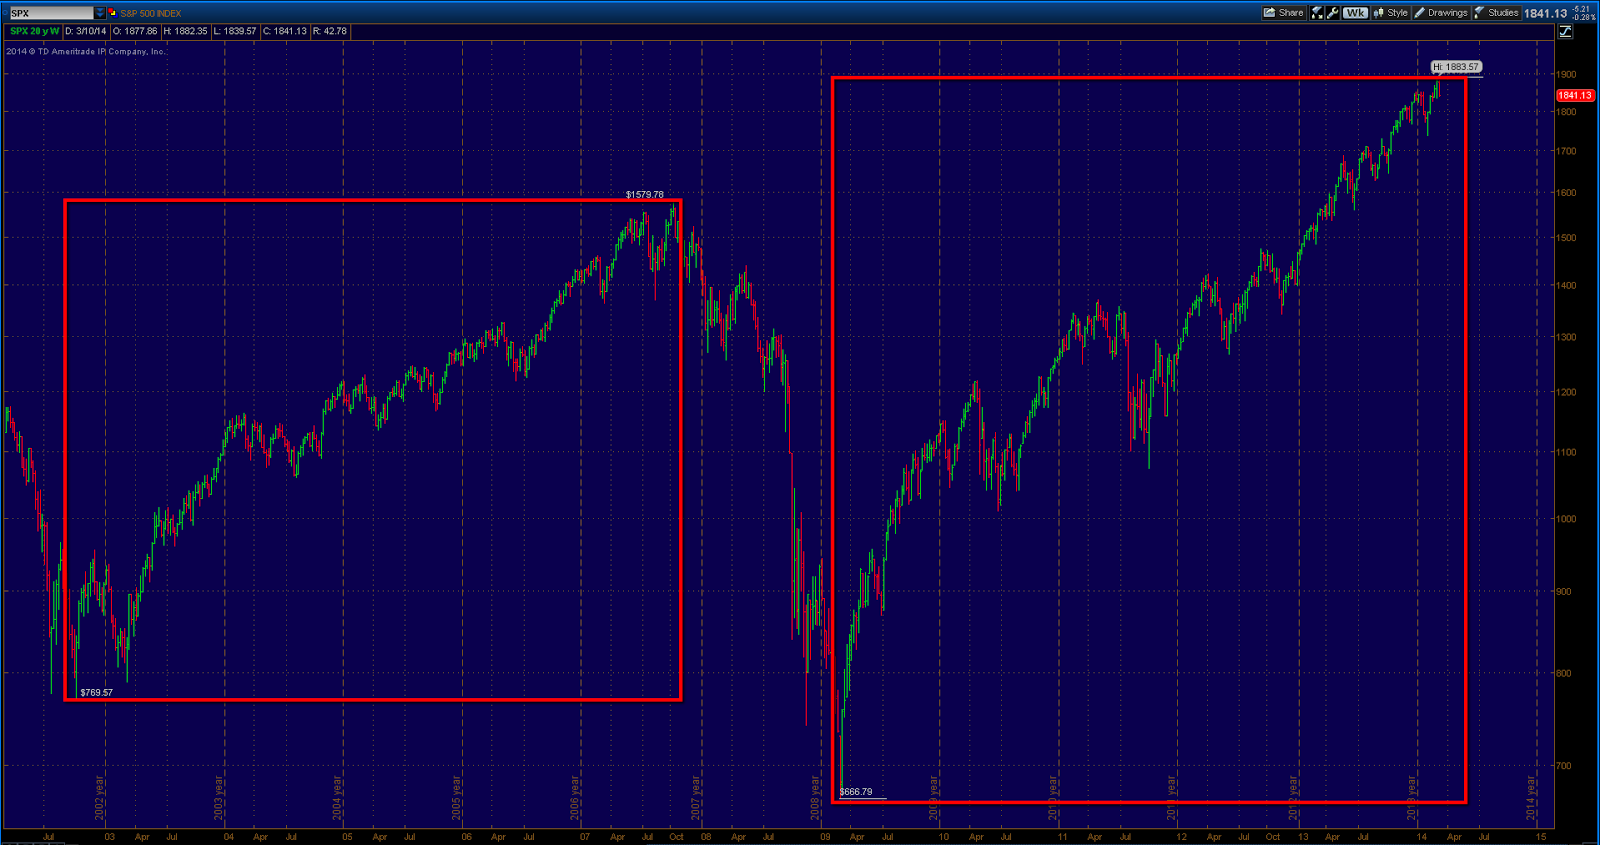
I've highlighted the corrections we have experienced in these five years, to go along with the breakdown of the previous bull market
I did last week. The first thing you should notice is that although this current bull market has surpassed the returns experienced in the 2002-2007 bull market, the volatility during has been much greater and harder to endure. During the 2002-2007 bull market we went over 4 years without a 10% correction. During this bull market we have already had 3 separate corrections of over 10%, including a 21% drop in 2011.
Like the saying goes "no pain, no gain". And while the doom and gloomers have continued to push their messages and agendas through every available medium, they have scared ordinary investors half to death. And while they wait for their 30%, 40% even 50% or more "crashes" in the stock market the S+P 500 has nearly tripled off it's 2009 low.
This next week will likely be a key week on both a technical and fundamental level. On Wednesday the new Federal Reserve chairman Janet Yellen will be holding her first press conference as Fed Chair, possibly giving more indications of future monetary policy and economic projections. And of course the events unfolding this weekend in Crimea may very well have at least a short term impact on the stock market as well.
Disclaimer: This website was created for entertainment and educational purposes only. Any opinions and analysis expressed anywhere on this site are for educational and entertainment purposes only, and ARE NOT guaranteed in any way. In no event shall Mikes Trading Journal and everyone involved, have any liability for any losses incurred in connection with any decision made, whether action or inaction, upon the information provided on this web site.
3rd party Ad. Not an offer or recommendation by Investing.com. See disclosure
here or
remove ads
.

