
Global equity markets continue to move wildly, driven largely by the latest headlines from Europe. Projecting and trading markets feels pointless when the next headline could dramatically move the market.
Arbor Research noted on The Big Picture:
"In the entire history of the S&P 500, there has never been a day in which all 500 stocks in the index go up or all 500 go down. There have been 11 days in which 490+ stocks all move in the same direction on a given day. Of those 11 instances, 6 have occurred since July 2011.
Add this all up and it appears as though macro themes, such as government intervention in the marketplace, will dictate returns. For the time being, stock picking is a dead art form and diversification is a largely unattainable goal."
I disagree somewhat that diversification is unattainable. Certain fixed income assets have done very well this year. However, if we are looking exclusively at US equities than I would tend to agree - it feels as if everything is moving in lockstep and this is supported by the data (chart courtesy of Arbor Research):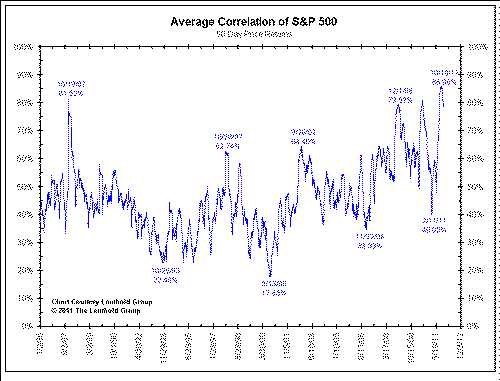
Ivan on Stocktwits noted this week:
"The so called “Risk On/Risk Off” cycle is a normal process. What isn’t normal about the current market, is the duration of this cycle. What used to take months, now takes days, which only reinforces the deeply ingrained recency bias in all market participants. The market has conditioned many of us to project the most recent price action into eternity and take profits by first signs of trouble. Everyone has become a trader in some form, even value investors."
While monster short-term rallys make us feel good, in my opinion they signal an unhealthy market filled with uncertainty and are most often accompanied by large short-term sell-offs.
With all this being said, there are a couple of key price levels to watch on the S&P 500 this week. SPY (SPDR S&P 500 ETF) is hitting some overhead resistance at the 200 day moving average. The 200 day SMA also coincides with a resistance level around the $126.50 level. If we are to see a year-end rally, this is the first technical hurdle for SPY: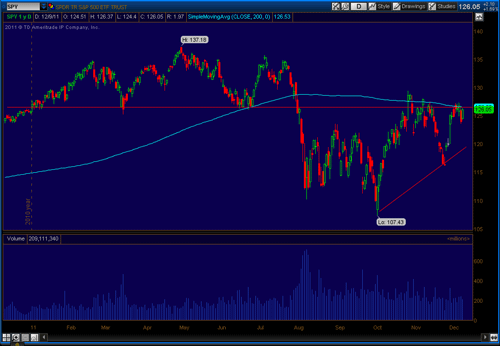
If we look at the S&P 500 Index on a weekly scale, we see an important support level was upheld this week. The fibonacci retracement levels from the low in July 2010 are drawn in red along with the 40 week moving average in blue. The 38.2% and 23.6% levels have acted as support and resistance in recent weeks, with the 38.2% level acting as support this week: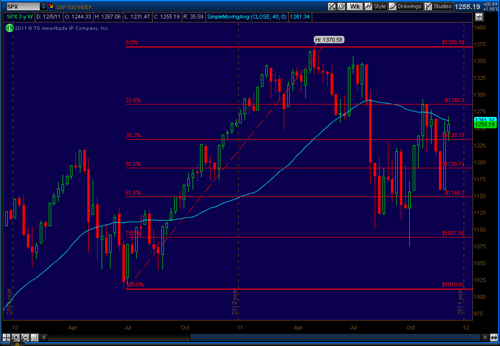
If the lack of movement in US stocks this year has you feeling down, consider the following graph. The US equity market is holding up remarkably well compared to the rest of the world. Below is year to date returns for SPY, EFA (iShares MSCI EAFE Index), GXC (SPDR S&P China), EEM (iShares MSCI Emerging Market), and EWZ (iShares MSCI Brazil Index):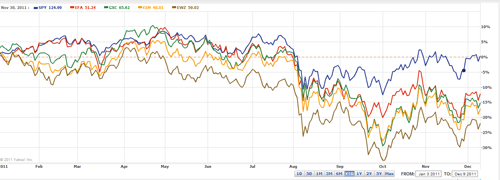
- English (UK)
- English (India)
- English (Canada)
- English (Australia)
- English (South Africa)
- English (Philippines)
- English (Nigeria)
- Deutsch
- Español (España)
- Español (México)
- Français
- Italiano
- Nederlands
- Português (Portugal)
- Polski
- Português (Brasil)
- Русский
- Türkçe
- العربية
- Ελληνικά
- Svenska
- Suomi
- עברית
- 日本語
- 한국어
- 简体中文
- 繁體中文
- Bahasa Indonesia
- Bahasa Melayu
- ไทย
- Tiếng Việt
- हिंदी
Headlines Throw Off Equity Markets
Published 12/12/2011, 03:43 AM
Updated 07/09/2023, 06:31 AM
Headlines Throw Off Equity Markets
Latest comments
Loading next article…
Install Our App
Risk Disclosure: Trading in financial instruments and/or cryptocurrencies involves high risks including the risk of losing some, or all, of your investment amount, and may not be suitable for all investors. Prices of cryptocurrencies are extremely volatile and may be affected by external factors such as financial, regulatory or political events. Trading on margin increases the financial risks.
Before deciding to trade in financial instrument or cryptocurrencies you should be fully informed of the risks and costs associated with trading the financial markets, carefully consider your investment objectives, level of experience, and risk appetite, and seek professional advice where needed.
Fusion Media would like to remind you that the data contained in this website is not necessarily real-time nor accurate. The data and prices on the website are not necessarily provided by any market or exchange, but may be provided by market makers, and so prices may not be accurate and may differ from the actual price at any given market, meaning prices are indicative and not appropriate for trading purposes. Fusion Media and any provider of the data contained in this website will not accept liability for any loss or damage as a result of your trading, or your reliance on the information contained within this website.
It is prohibited to use, store, reproduce, display, modify, transmit or distribute the data contained in this website without the explicit prior written permission of Fusion Media and/or the data provider. All intellectual property rights are reserved by the providers and/or the exchange providing the data contained in this website.
Fusion Media may be compensated by the advertisers that appear on the website, based on your interaction with the advertisements or advertisers.
© 2007-2024 - Fusion Media Limited. All Rights Reserved.