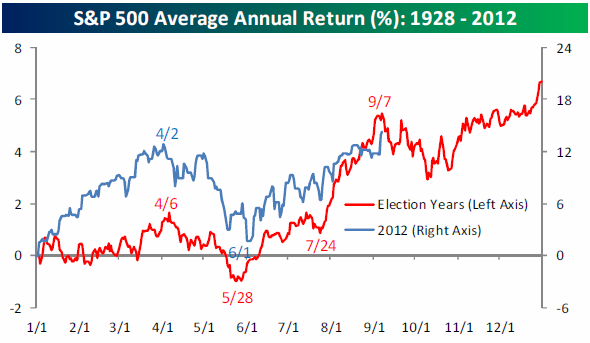
However much I want to believe that it is a top and the road is down, I am not jumping the gun yet. Yes it is topping but even with this 1% drop (wow!) (how come Ben?) we do not have the sell signal yet. Remember that chart of Presidential Election Cycle from Bespoke? Here it is for your ready reference:
So it is just about time for a correction. Whether it will be 3% -5% correction or 10% + correction, we will have to wait and see. As of now it is a warning shot. The line in the sand /ES 1445 has been broken. The indexes opened high, reached higher and closed in red, which means that more correction ahead. It need not be tomorrow though because SPX has 4 red days in a row and a bounce is due.
Yesterday I wrote that we will see a test of the high today and a top is near. We did see SPX reach 1462.80 before selling off. So it is on script.
In the morning I tweeted that all the asset classes are selling in sync. But when the indexes dropped hard in the last two hours, oil, gold and silver did not budge much. May be gold and silver will sell off in the Asian session , so I am willing to wait a while longer to decide if the sell-off is real or it’s a head fake. In all probabilities, we will see a bounce in the next few days.
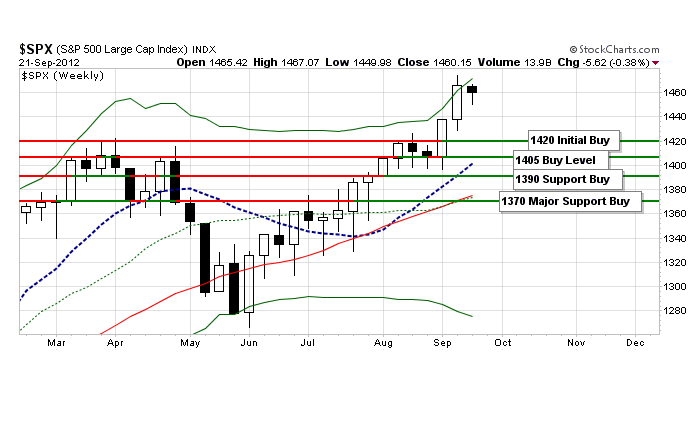
I want to share a chart from Lance Roberts:
Lance thinks that any correction here is a buying opportunity and I somewhat agree with him, at least till election. I would love the indexes do a dead cat bounce, re-test the high in the next few days or so and roll over 100 SPX points, but that’s just wish full thinking.
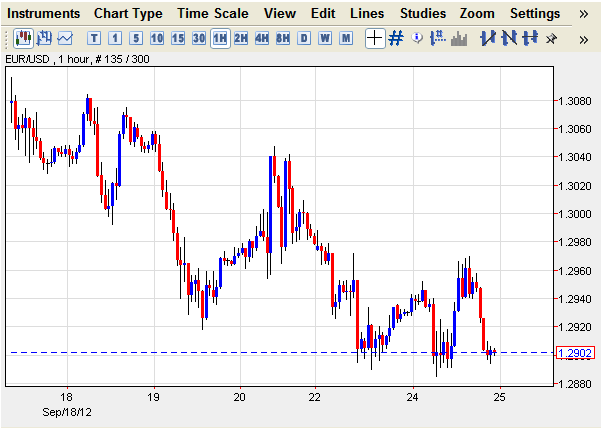
Euro is hanging around 1.29 levels and it has already made three attempts to break below and have bounced from there. Will 3rd time be the charm? If it breaks from here the next level is 1.2750 and it will take equities along with it. 
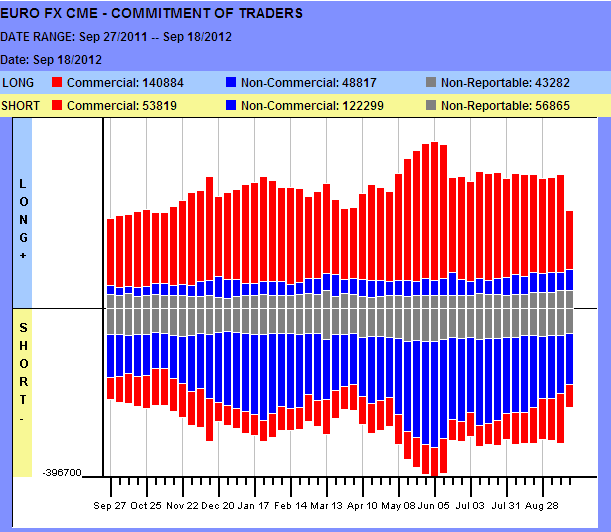
The Euro position in the latest COT report shows that commercials are still net long Euro by almost 3 times.
However, the long for the last week has come down to 140 k from 230 k. which is almost 40% drop in the long position in one week and that indicates that the commercials may be winding down their long position. We will keep an eye on this one. If you remember, in the past I had repeatedly mentioned that commercials are long Euro and all talks of Euro disintegration is just talk, at least for now.
Bonds gave a buy signal and their bounce seems to be more serious kind of bounce. From $132 in end of July, TLT came down to $118 on 14th Sept. It has now bounced back to $ 123. I think it will re test the high one more time before the boom is over.
Thanks for sharing my thoughts. Join me in twitter for the real time market action and to avoid head fakes (@BBFinanceblog). By the way, the blog now has a “ Donate” button and your contributions will be my stimulus package.
- English (UK)
- English (India)
- English (Canada)
- English (Australia)
- English (South Africa)
- English (Philippines)
- English (Nigeria)
- Deutsch
- Español (España)
- Español (México)
- Français
- Italiano
- Nederlands
- Português (Portugal)
- Polski
- Português (Brasil)
- Русский
- Türkçe
- العربية
- Ελληνικά
- Svenska
- Suomi
- עברית
- 日本語
- 한국어
- 简体中文
- 繁體中文
- Bahasa Indonesia
- Bahasa Melayu
- ไทย
- Tiếng Việt
- हिंदी
Have We Seen The Market Top?
Published 09/25/2012, 07:21 PM
Updated 07/09/2023, 06:31 AM
Have We Seen The Market Top?
Latest comments
Loading next article…
Install Our App
Risk Disclosure: Trading in financial instruments and/or cryptocurrencies involves high risks including the risk of losing some, or all, of your investment amount, and may not be suitable for all investors. Prices of cryptocurrencies are extremely volatile and may be affected by external factors such as financial, regulatory or political events. Trading on margin increases the financial risks.
Before deciding to trade in financial instrument or cryptocurrencies you should be fully informed of the risks and costs associated with trading the financial markets, carefully consider your investment objectives, level of experience, and risk appetite, and seek professional advice where needed.
Fusion Media would like to remind you that the data contained in this website is not necessarily real-time nor accurate. The data and prices on the website are not necessarily provided by any market or exchange, but may be provided by market makers, and so prices may not be accurate and may differ from the actual price at any given market, meaning prices are indicative and not appropriate for trading purposes. Fusion Media and any provider of the data contained in this website will not accept liability for any loss or damage as a result of your trading, or your reliance on the information contained within this website.
It is prohibited to use, store, reproduce, display, modify, transmit or distribute the data contained in this website without the explicit prior written permission of Fusion Media and/or the data provider. All intellectual property rights are reserved by the providers and/or the exchange providing the data contained in this website.
Fusion Media may be compensated by the advertisers that appear on the website, based on your interaction with the advertisements or advertisers.
© 2007-2024 - Fusion Media Limited. All Rights Reserved.
