Looking at the vehicle sales, at first glance it seems they have evolved from disastrous to almost fully recovering pre-recession levels.
I continue to wonder what dynamic is driving this sales recovery.
Figure 1 – Total Vehicle Sales
Factors affecting vehicle sales appear to have offsetting factors:
- there should be at least a 15 million vehicle pent up demand since the beginning of 2007;
- vehicles are lasting longer and are more durable;
- the median consumer is poorer;
- half the vehicles (by sales sales price) are purchased by businesses which were seeing record profits.
Of course per capita vehicle sales still remains at recessionary levels.
Figure 2 – Per Capita Sales of Vehicles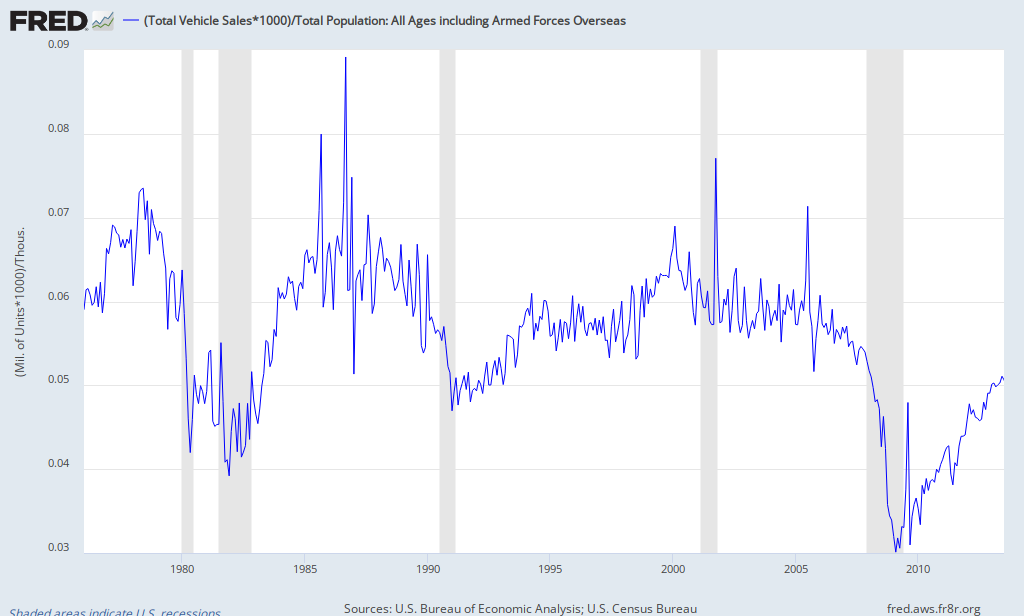
Inventories have been growing, and are above pre-recession levels (current dollars) – but price inflation since 2000 has been mild. One reason that price inflation per vehicle sold has been minimal is the trend from steak to hamburger.
Figure 3 – Index, Value of Inventories (red line) and Price Inflation (blue line)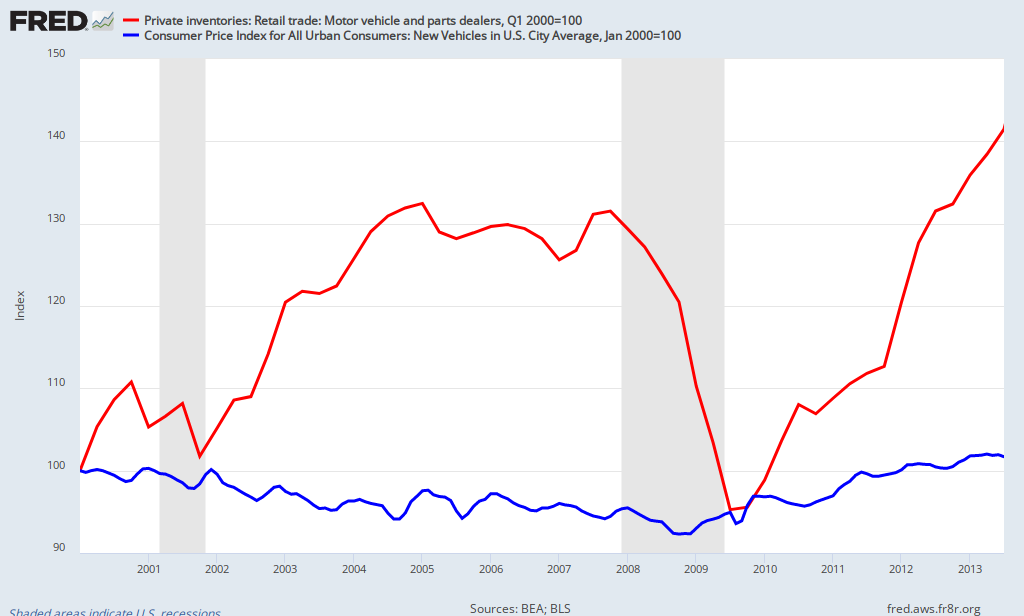
It is interesting that used vehicles sales have been declining.
Figure 4 – Used Vehicle Sales
Imported cars sales have been trending down. My opinion is that productivity (aka robotics) improvements favor USA production.
Figure 5 – Ratio of Imported Autos to Domestic Autos Sold
Man-hours per auto have fallen by 1/4 since 2004 for USA production.
Figure 6 – Man-hours Per Auto
I am a trend kind of guy. A trend remains in play until it ends – and there are no apparent dynamics which suggests vehicle sales trend will not continue to improve.
Other Economic News this Week:
The Econintersect economic forecast for September 2013 improved but still shows the economy barely expanding. The concern is that consumers are spending a historically high amount of their income, and several non-financial indicators are weak.
The ECRI WLI growth index value has been weakly in positive territory for over four months – but in a noticeable improvement trend. The index is indicating the economy six month from today will be slightly better than it is today.
Current ECRI WLI Growth Index
Initial unemployment claims went from 331,000 (reported last week) to 323,000 this week. Historically, claims exceeding 400,000 per week usually occur when employment gains are less than the workforce growth, resulting in an increasing unemployment rate.
The real gauge – the 4 week moving average – improved from 331,250 (reported last week) to 328,500. Because of the noise (week-to-week movements from abnormal events AND the backward revisions to previous weeks releases), the 4-week average remains the reliable gauge.
Weekly Initial Unemployment Claims – 4 Week Average – Seasonally Adjusted – 2011 (red line), 2012 (green line), 2013 (blue line)
Bankruptcies this Week: Longview Power,
Data released this week which contained economically intuitive components(forward looking) were:
- Rail movements growth trend is currently accelerating .
All other data released this week either does not have enough historical correlation to the economy to be considered intuitive, or is simply a coincident indicator to the economy.
Weekly Economic Release Scorecard:
Click here to view the scorecard table below with active hyperlinks