H&R Block, Inc. (HRB) is a tax service provider. H&R Block has subsidiaries that provide tax, banking and business and consulting services.
The news driving the stock today surrounds a reorg, layoffs and office closings. I’ve included a snippet from the news below:
H&R Block (HRB) notified the market of an impending shakeup late Wednesday, and investors promptly dumped the company’s shares, sending the stock down 16% in trading after the close.
The tax prep company said it will cut 350 positions and close 2o0 offices as part of an effort to save $85 million to $100 million a year.
The company also announced management changes. The president of retail tax services resigned and HRB said it is looking for a new CFO to replace Jeff Brown.
Source: Barron’s via Yahoo! Finance, H&R Block Cutting Jobs, Offices; Shares Plungee written by Avi Salzman.
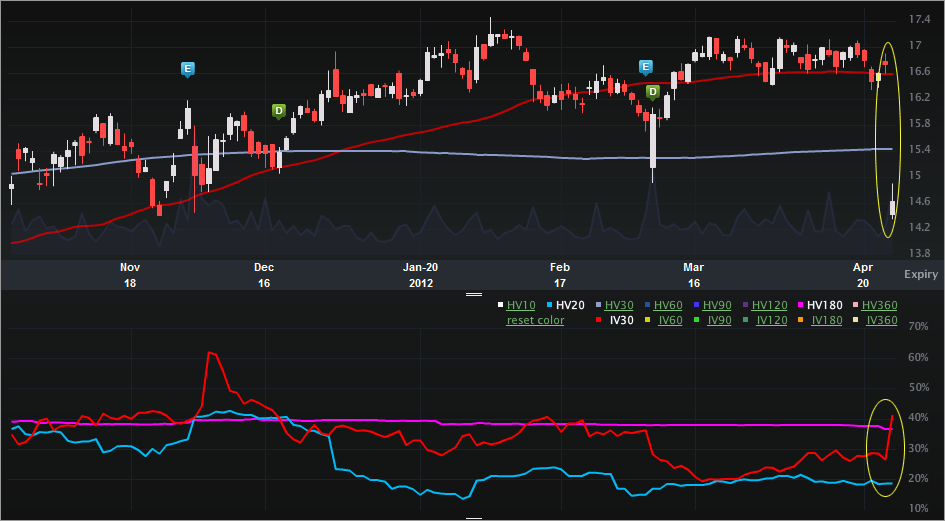
The market certainly doesn’t like the news but a bit of a vol story has developed because of this move and I want to explore it. Let’s turn to the Charts Tab (six months), below. The top portion is the stock price, the bottom is the vol (IV30™ - red vs HV20™ - blue vs HV180™ - pink).
On the stock side it’s pretty simple – the underlying has gapped down today to near the six month closing low of $14.41. On the vol side, we can see the gap up. The 52 wk range in IV30™ is [19.50%, 62.54%], putting the current level in the 47th percentile (annual). I do make note of how depressed the HV20™ at 18.78% is relative to the implied (though that number does not include the move today).
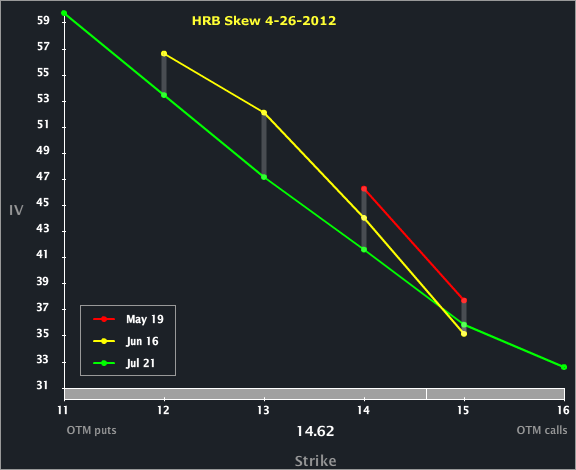
Let’s turn to the Skew Tab.
At first blush all seems kinda normal. Certainly, the shape of the skew shows no kinks and the vol rises to the OTM puts as expected. HRB earnings are usually in Mar, Jun (late), Sep and Dec. So, that Jul vol in fact has an earnings date embedded and it will be the first planned earnings announcement after the news today.
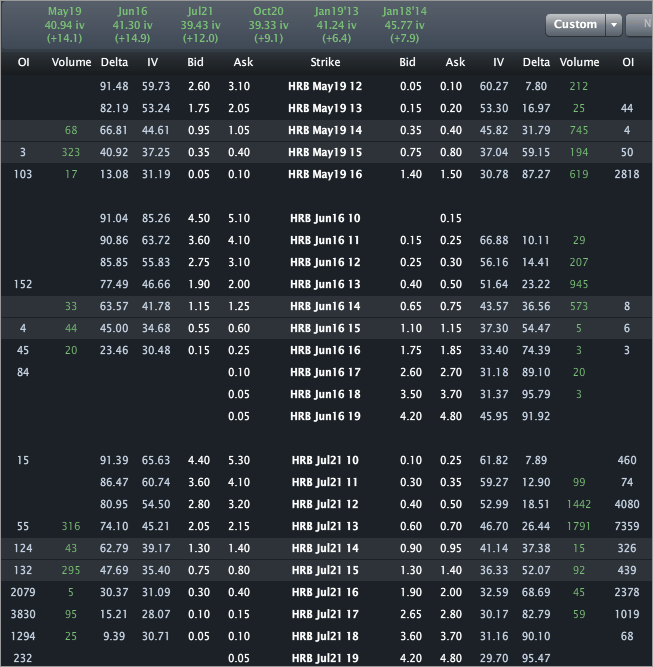
Let’s turn to the Options Tab to look at some actual numbers.
I wrote about this one for TheStreet (OptionsProfits), so no specific trade analysis here. We can see across the top the vols of 40.94%, 41.30% and 39.43% for May, Jun and Jul, respectively. For the last two years, earnings have fallen on Jun 23rd and 24th – so after the Jun option cycle (but inside Jul). Noting that the current IV30™, though elevated today, is still pretty “middle of the road” and that Jul with earnings (the first after this news) is priced below the IV30™, that makes for a noteworthy vol phenomenon.
This is trade analysis, not a recommendation.
- English (UK)
- English (India)
- English (Canada)
- English (Australia)
- English (South Africa)
- English (Philippines)
- English (Nigeria)
- Deutsch
- Español (España)
- Español (México)
- Français
- Italiano
- Nederlands
- Português (Portugal)
- Polski
- Português (Brasil)
- Русский
- Türkçe
- العربية
- Ελληνικά
- Svenska
- Suomi
- עברית
- 日本語
- 한국어
- 简体中文
- 繁體中文
- Bahasa Indonesia
- Bahasa Melayu
- ไทย
- Tiếng Việt
- हिंदी
H&R Block Shares Fall On News; Vol Move Yields Noteworthy Phenomenon
Published 04/27/2012, 05:46 AM
Updated 07/09/2023, 06:31 AM
H&R Block Shares Fall On News; Vol Move Yields Noteworthy Phenomenon
3rd party Ad. Not an offer or recommendation by Investing.com. See disclosure here or
remove ads
.
Latest comments
Install Our App
Risk Disclosure: Trading in financial instruments and/or cryptocurrencies involves high risks including the risk of losing some, or all, of your investment amount, and may not be suitable for all investors. Prices of cryptocurrencies are extremely volatile and may be affected by external factors such as financial, regulatory or political events. Trading on margin increases the financial risks.
Before deciding to trade in financial instrument or cryptocurrencies you should be fully informed of the risks and costs associated with trading the financial markets, carefully consider your investment objectives, level of experience, and risk appetite, and seek professional advice where needed.
Fusion Media would like to remind you that the data contained in this website is not necessarily real-time nor accurate. The data and prices on the website are not necessarily provided by any market or exchange, but may be provided by market makers, and so prices may not be accurate and may differ from the actual price at any given market, meaning prices are indicative and not appropriate for trading purposes. Fusion Media and any provider of the data contained in this website will not accept liability for any loss or damage as a result of your trading, or your reliance on the information contained within this website.
It is prohibited to use, store, reproduce, display, modify, transmit or distribute the data contained in this website without the explicit prior written permission of Fusion Media and/or the data provider. All intellectual property rights are reserved by the providers and/or the exchange providing the data contained in this website.
Fusion Media may be compensated by the advertisers that appear on the website, based on your interaction with the advertisements or advertisers.
© 2007-2024 - Fusion Media Limited. All Rights Reserved.
